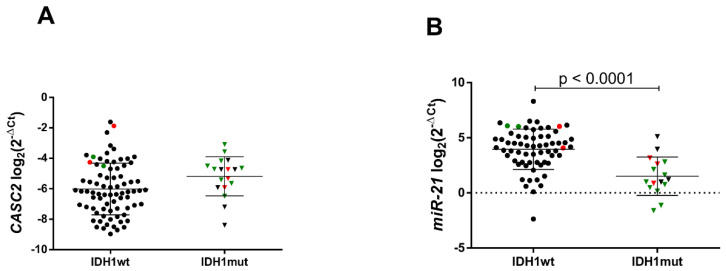
Figure 2.
CASC2 (A) and miR-21 (B) gene expression in IDH1wt and IDH1mut gliomas. The lines in the graphs indicate mean with the SD. Color corresponds to different glioma malignancy grade: green reflects grade II, red—grade III, black—grade IV gliomas. Triangle shape corresponds to isocitrate dehydrogenase 1 mutated C. 395G > A (IDH1mut) glioma, circle shape—isocitrate dehydrogenase 1 wild-type (IDH1wt).

