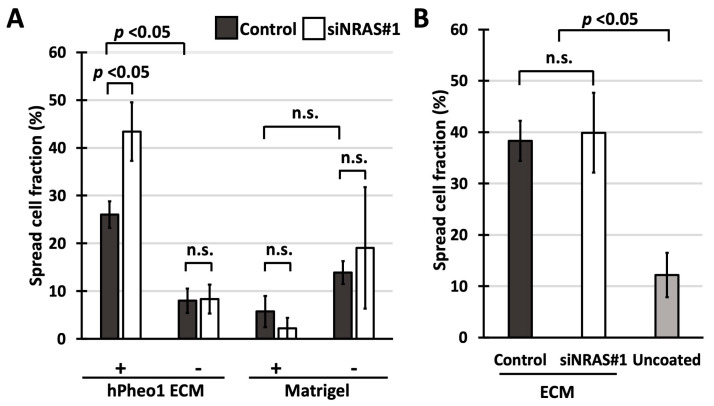
Figure 4.
(A,B) Fraction of cells exhibiting spread morphology presented as percentages (mean ± standard deviation) in spreading assays using cell culture-derived ECMs and Matrigel. (A) Spreading of control-transfected and siNRAS#1-treated hPheo1 cells on plates coated with ECMs prepared from untreated hPheo1 cells or Matrigel (+), and uncoated plates (-) after 1 h in serum-free conditions. (B) Spreading of untreated hPheo1 cells on ECMs prepared from control-transfected and siNRAS-treated hPheo1 cells (dark-gray and white bars, respectively), and on uncoated wells (light-grey bar) after 1 h in serum-free conditions. All results are from three independent siRNA experiments. If significant one-way ANOVA result, student’s T-test p values were calculated and corrected ad modum Bonferroni. n.s., no significance.

