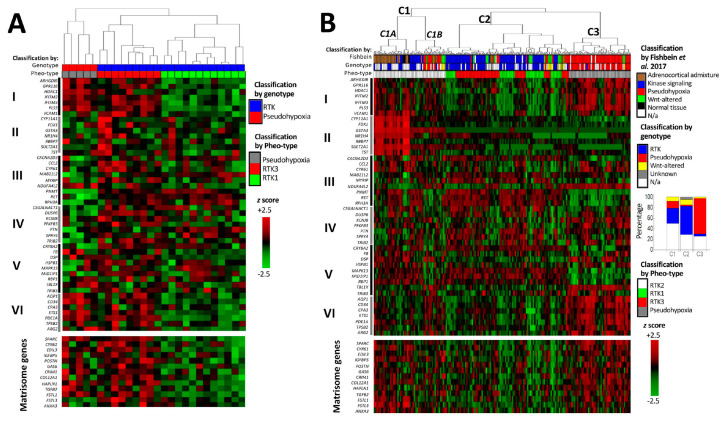
Figure 5.
cDNA hybridization microarray data on Scandinavian PPGL with known genotype (A) [36] and RNA-sequencing data on The Cancer Genome Atlas cohort (B) [14]. The upper heatmap panel displays the expression profile of the Pheo-Type gene set, and the lower panel displays the expression of matrisome-related genes downregulated by NRAS in the hPheo1 cell line. Pheo-Type gene set subdivisions are as described by Flynn et al. [37] and denominated with Roman numerals I–VI (explained in the text). Genotypic subtype indicated as pseudohypoxic (red; VHL, SDHx, EPAS1, IDH1, or EGLN1 mutation), receptor tyrosine kinase (RTK)-driven (blue; NF1, HRAS, RET, FGFR1, TMEM127, BRAF, NFGR or MAX mutation), WNT-altered (yellow; CSDE1 or MAML3 mutation), not applicable (N/a, white), i.e., unknown mutation or known mutation of uncertain mRNA subtype (SETD2, TP53, ATRX). Pheo-Type cluster classification indicated as pseudohypoxic (grey; C3), RTK1 (Green; C2), RTK2 (white; C1A/B) or RTK3 (red; C3). Dendrograms are longitudinally compressed for visualising purposes.

