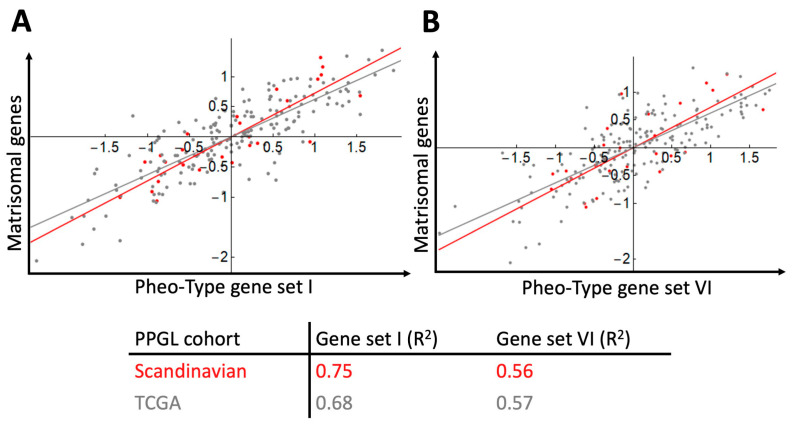
Figure 6.
Gene signature scores for PPGL samples (Scandinavian cohort, n = 26, red dots and line; TCGA cohort, n = 186, grey dots and line) and correlation of the matrisomal gene signature downregulated by NRAS in hPheo1 and the pseudohypoxia-related Pheo-Type gene sets I (A) and VI (B). Correlation coefficients (R2) for each cohort data set are provided.

