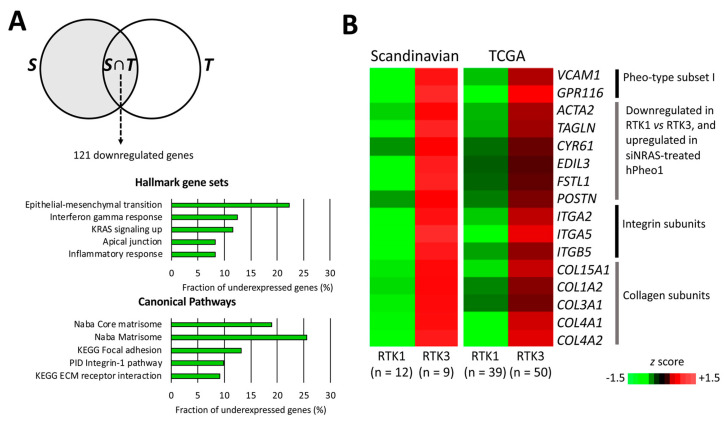
Figure 7.
Comparison of RTK1 and RTK3 subclusters. (A) Venn diagram (upper panel) illustrating the analysis workflow for patient cohort data. RTK1 tumours were compared to RTK3 tumours in the Scandinavian cohort S (grey area). Expression values of significantly under-expressed genes were extracted from the TCGA cohort and the RTK1 and RTK3 clusters were compared (student’s T-test p < 0.05 with correction ad modum Bonferroni), yielding the intersection of S and differentially expressed genes in the TCGA cohort (T), i.e., S∩T, which contained 121 genes significantly downregulated in RTK1 lesions from both cohorts. In the lower panels, the top five significantly under-represented gene sets in RTK1 from the Hallmark (middle panel) and Canonical Pathways set collections (lower panel) are shown. (B) Expression of genes downregulated in the RTK1 cluster of both cohorts and either belonging to Pheo-type subset I, or being upregulated by siNRAS treatment of hPheo1 cells, or encoding integrin and collagen subunits; expressed as the mean z score for each group.

