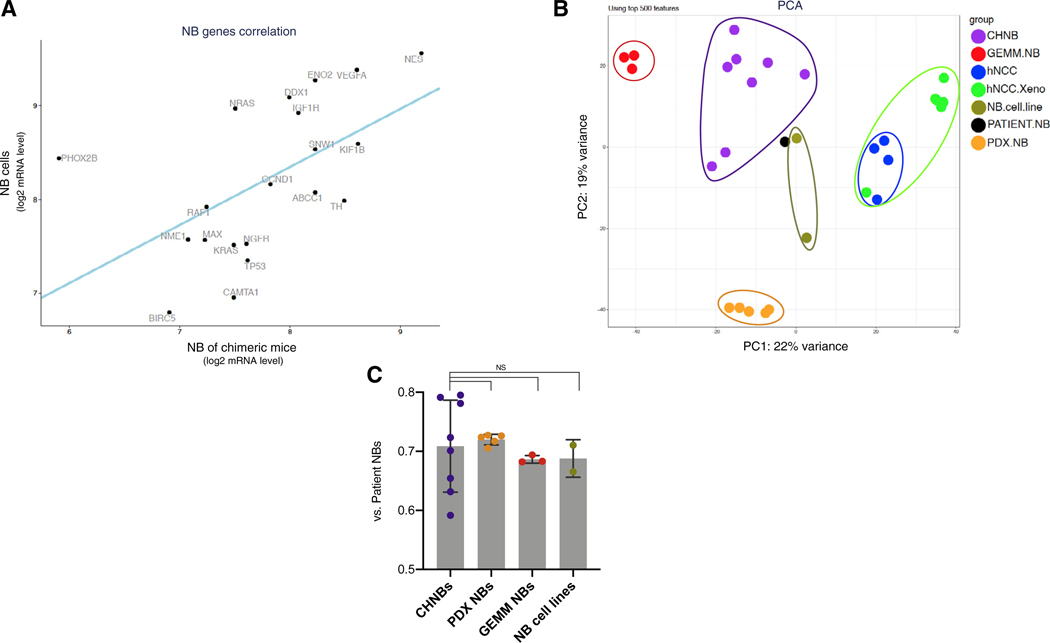
Figure 3. CHNB Tumors Present Gene Expression Profiles Similar to Human NB.
(A) RNA-seq analysis of the human genes expressed in CHNB show a significant correlation in the expression of a panel of key genes normally expressed in NB tumors (ABCC1, BIRC5, CAMTA1, CCND1, DDX1, ENOS, IGF1R, KIF1B, KRAS, MAX, NES, NGFR, NME1, NRAS, PHOX2B, RAF1, SNW1, TH, TP53, and VEGFA) with NB cell lines (Kelly and SH-SY5Y; p value = 0.011, linear regression).
(B) Principal component (PCA) analysis of CHNBs (purple), patient NB samples (black), PDX NB (orange), GEMM NB (red), NB cell lines (olive), hNCCs (blue), and Dox-induced hNCC xenografts (green). 669 RNA-seq samples of NB patients are presented as a meta-sample (in black), which represents the median expression levels of all genes across multiple samples.
(C) A direct comparison of the fraction of genes, which are similarly expressed in CHNBs and in NB models when compared to NB patients (CHNB, PDX, GEMM, or cell lines versus Patient NB; Δ < 2-fold) revealed that all four models show comparable fraction of shared genes. Bars presented as means; error bars represent SD; p values range = 0.75–0.64, t test.

