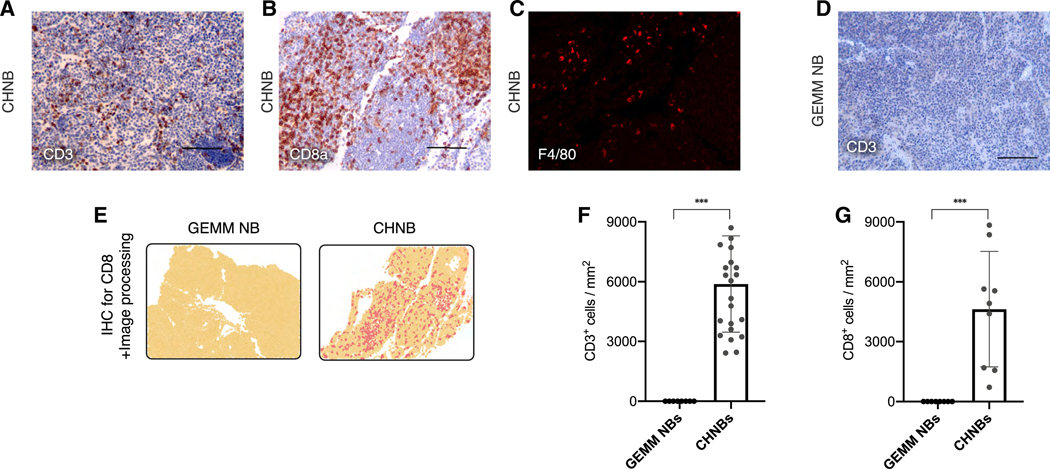
Figure 5. Immune-Microenvironment of NB Tumors Formed in Mouse-Human Chimeras.
(A–C) Host T cell, CTL, and macrophage infiltration marked by CD3 (A), CD8 (B), and F4/80 (C) in NB tumors of chimeric mice.
(D) No CD3+ T cell infiltrate was observed in a NB of GEMM (Th-MYCN+ALKF1174L).
(E) Representative fields of IHC staining of CHNB and GEMM NB for CD8a, followed by software analysis for quantifications of IHC and immune scores (yellow, tissue area; dark yellow, nuclei staining; red, DAB staining for CD8a; see STAR Methods).
(F and G) Quantifications of IHC experiments for mouse-specific CD3 (F) and CD8a (G) for comparing immune cell infiltration in tumors of GEMM NB (n = 2) and CHNB (n = 6). Data presented as means; error bars represent SD; *** p value < 0.0001, t test.

