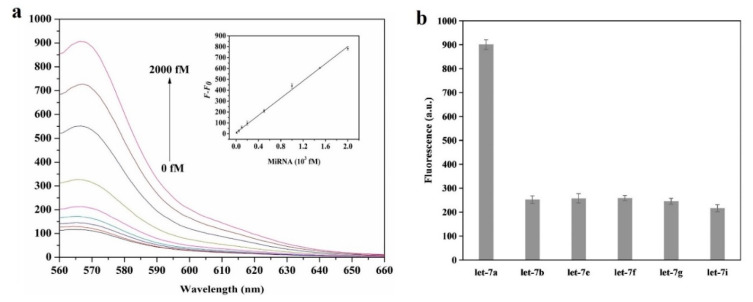
Figure 6.
(a) Fluorescence spectra of the HCR/GO biosensor in the presence of different concentrations of let-7a (from bottom to top 0, 10 fM, 50 fM, 100 fM, 200 fM, 1 pM, 1.5 pM, 2 pM). Inset: linear relationship between the fluorescence intensity change (F–F0) and let-7a concentration. (b) Specificity assay with let-7b, let-7e, let-7f, let-7g, let-7i (concentration 2 pM). (a,b) Reprinted [53], Copyright 2018, with permission from Elsevier.

