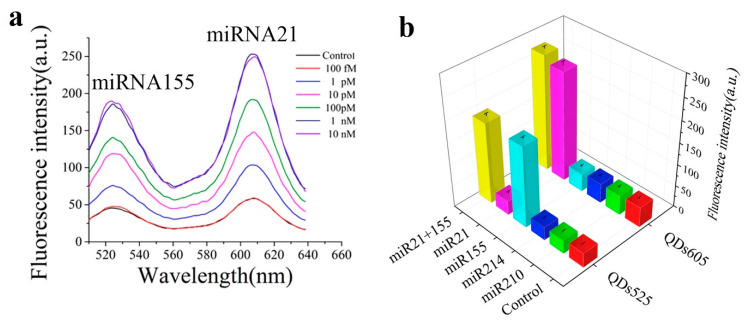
Figure 7.
(a) Fluorescence spectra of samples with different concentrations of miR-21 and miR-155 (control represents the sample without any miRNA) (b) Specificity assay with no miRNA (Control), miR-210-3p (indicated as miR-210) and miR-214 (concentration 100 pM). (a,b) Reprinted [55], Copyright 2017, with permission from Elsevier.

