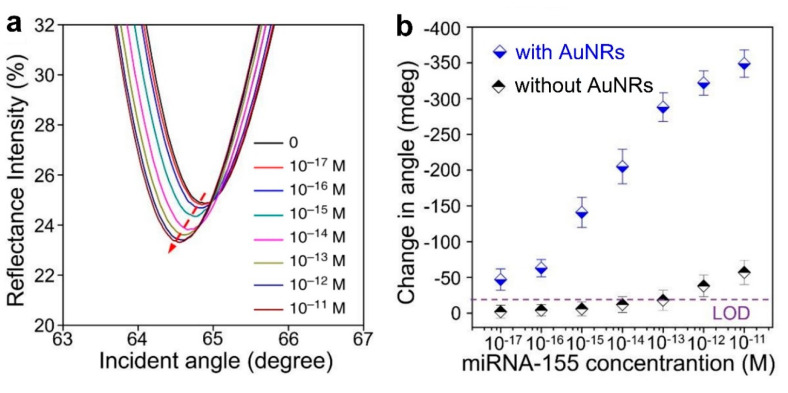
Figure 9.
(a) Surface plasmon resonance (SPR) spectra with miR-155 concentrations ranging from 10−17 to 10−11 M obtained using gold nanorod (Au NR) amplification. The arrow denotes the shift in the SPR angle. (b) Relationship between the SPR angle and miR-155 concentration using DNA probes with and without Au NRs. (a,b) Adapted under the terms of the Creative Commons Attribution 4.0 International License (https://creativecommons.org/licenses/by/4.0/) [63]. Copyright 2019, The Authors. Published by Nature Communications.

