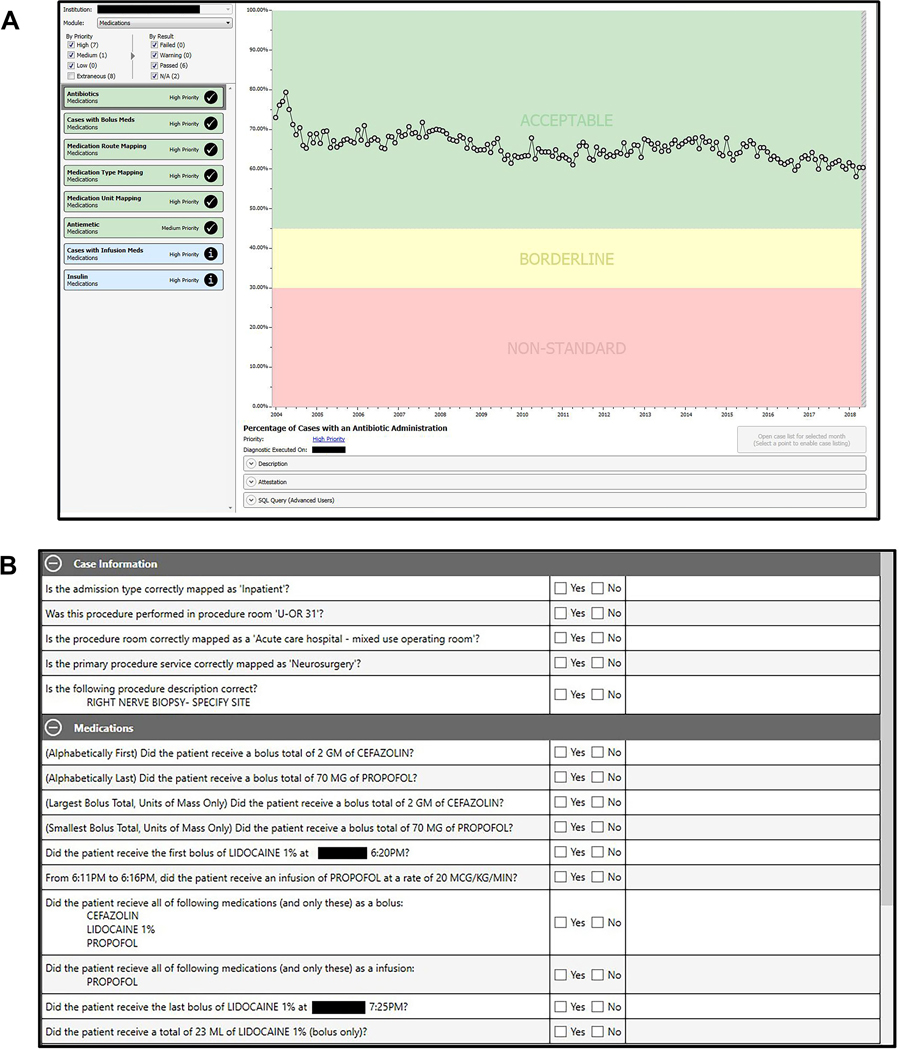
Figure 4.
MPOG Data Diagnostics and Case Validation Tools. A, The output of one of multiple data diagnostic control charts is demonstrated. Charts are color coded and prioritized to focus work on improving highest priority data elements. B, The case-by-case review is demonstrated, whereby the extracted record is compared against the source medical record and clinician attests to the accuracy of the detailed extraction. Both panels have been edited for clarity and to remove identifying information. MPOG indicates Multicenter Perioperative Outcomes Group; U-OR 31, operating room 31.

