Figure 5.

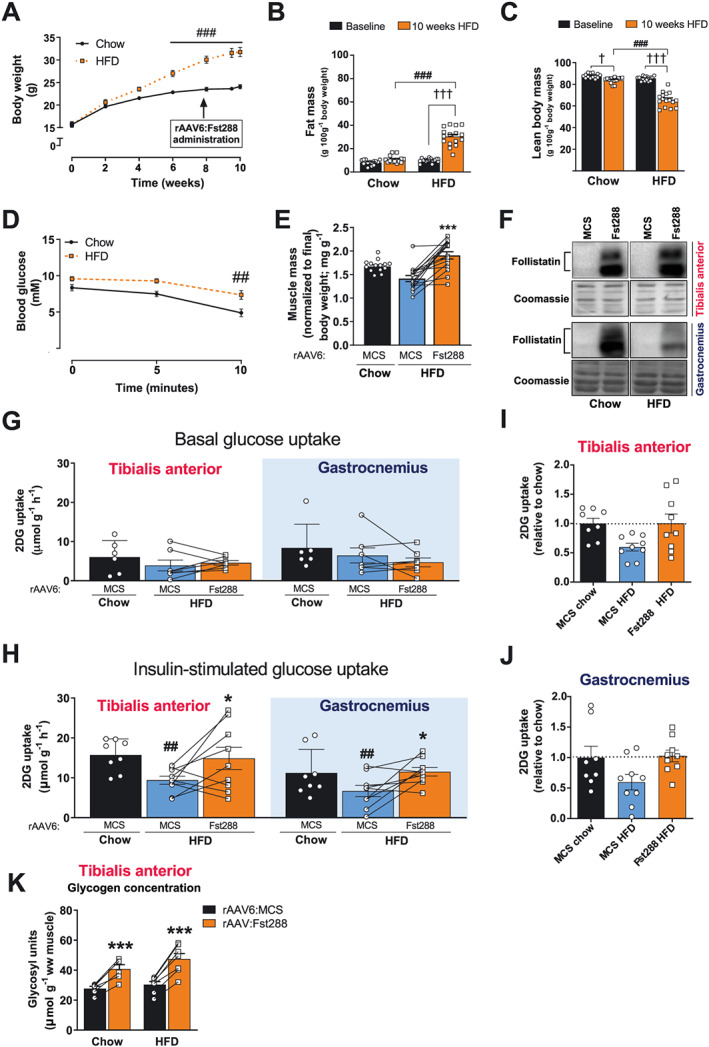
Effect of Fst288 overexpression in insulin‐resistant obese mice. (A) Body weight, (B) fat mass, and (C) lean body mass of mice fed a standard chow diet or 60E% high‐fat diet (HFD) for 10 weeks (n = 14–16). (D) Blood glucose in response to insulin (retro‐orbitally injected, 0.3 U kg−1 body weight) (n = 8–9). (E) Muscle mass of tibialis anterior muscle (n = 14–16). (F) Representative blots of follistatin in tibialis anterior and gastrocnemius muscle 2 weeks following intramuscular rAAV6:Fst288 injection. (G) Basal (saline injected) and (H) insulin‐stimulated 2‐deoxy‐glucose (2DG) uptake in tibialis and gastrocnemius muscles intramuscularly injected with rAAV6:Fst288 or rAAV6:MCS (control). Insulin‐stimulated 2DG uptake relative to chow rAAV6:MCS in (I) tibialis anterior and (J) gastrocnemius muscle. (K) Glycogen content determined as glycosyl units in tibialis anterior muscle (n = 6–8). Statistical significant difference between baseline and 10 week time point is indicated by †/††† P < 0.05/0.001. Statistically significant effect of Fst288 overexpression is indicated by */*** P < 0.05/0.001. Statistical significance between HFD and chow control mice is indicated by ##/### P < 0.01/0.001. Data are shown mean ± SEM with individual values shown when applicable.
