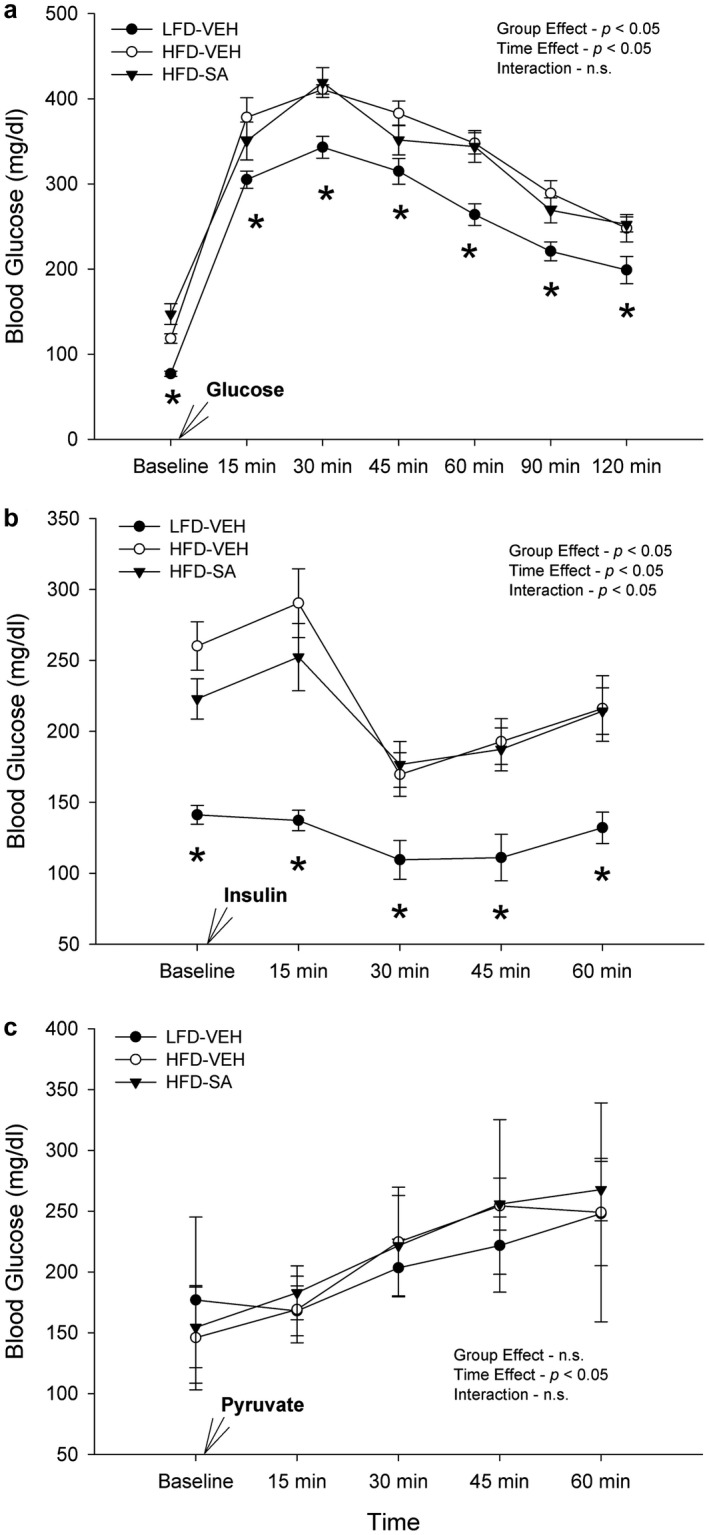
FIGURE 4.

Glucose tolerance test (a), insulin tolerance test (b), and pyruvate tolerance test (c) in low‐fat diet (LFD) or high‐fat diet (HFD)‐fed mice treated with vehicle (VEH) or succinic acid (SA). *p < .05 HFD‐VEH versus HFD SA. Data are mean ± SD
