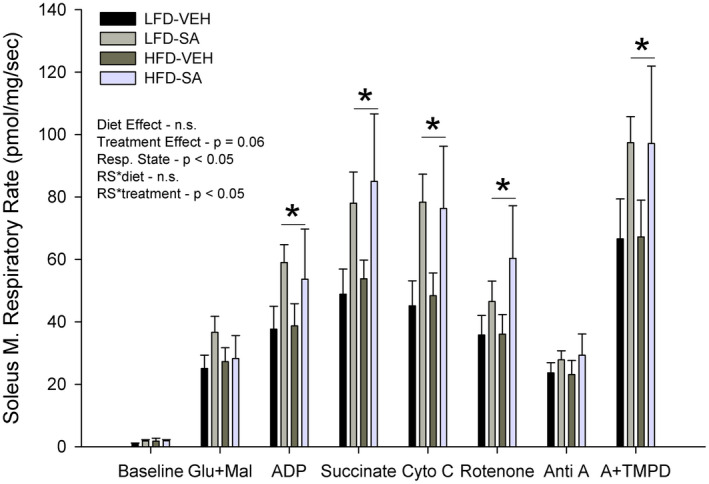
FIGURE 5.

Mitochondrial respiratory capacity in low‐fat (LFD) or high‐fat diet (HFD) mice treated with vehicle (VEH) or succinic acid (SA). Glu + Mal = Complex I, (CI) State 2 (S2) respiration, ADP = CI S3, Succinate CI + II S3, Cyto C = check mitochondrial membrane integrity, Rotenone = CII S3, Anti A = C III inhibitor, A + TMPD = maximal C IV activity. Data are mean ± SD. *p < .05 SA treated versus VEH
