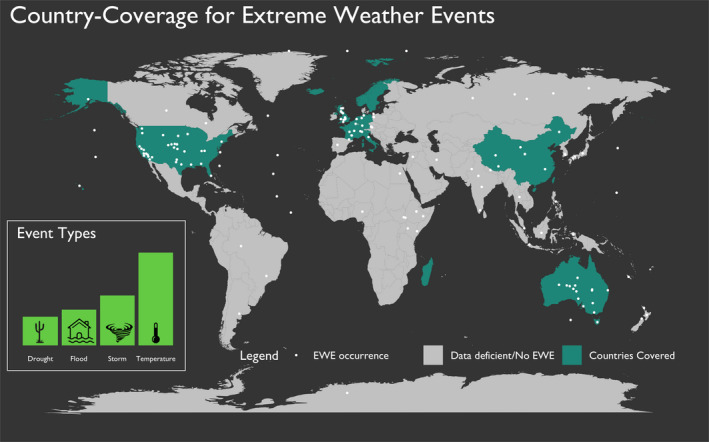
FIGURE 1.

Location of EWEs (white dots) as reported by the American Meteorological Society (Herring et al., 2019). Countries colored in green contain the locations of the demographic responses to EWE in our review that reported the context of the EWE intensity and the demographic responses. Countries colored in gray did not have any reports of demographic responses to EWE that included the context of the EWE intensity and the demographic response. Inset map displays the frequency distribution of each of the EWE categories in our review
