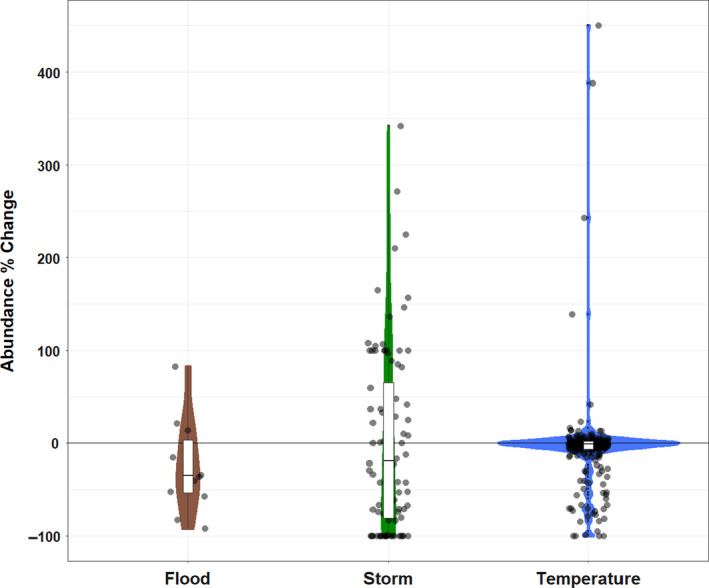
FIGURE 3.

The effect of three different categories of extreme weather events on population abundance summarized from 352 records from 14 papers. Colored areas are violin plots estimated with a Gaussian kernel. Boxplots represent the median and interquartile range of the abundance changes for each EWE type. The −100% value on the y‐axis represents extirpation of the population
