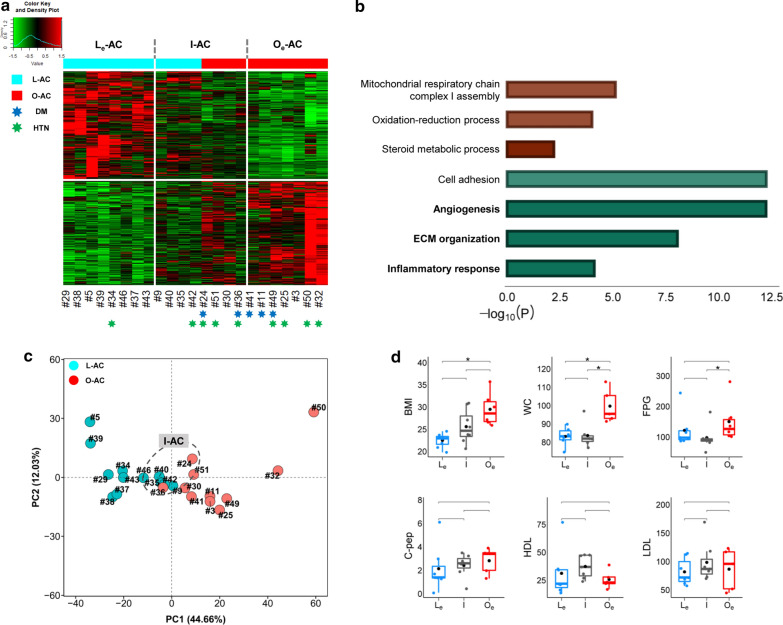
Fig. 2.
Classification of AC samples by DEGs. a Construction of the heatmap accompanied by unsupervised hierarchical clustering. Heatmap coupled with unsupervised hierarchical clustering is generated by the 1,198 DEGs that are estimated by comparing mRNA expression with P < 0.01 between 12 L-AC and 11 O-AC samples. Cyan and red bars located at top of the heatmap are replaced for the dendrograms generated by the clustering procedure where cyan and red bars represent lean and obese samples, respectively. ‘Le’, ‘I’, and ‘Oe’ represent extreme, intermediate, and obese extremes, respectively, as explained in the main text. The samples in blue and green ‘*’ indicate whether the patients have been treated with drugs for diabetes (DM) or hypertension (HTN), respectively. b GO analysis of ‘AC-DEGs’; the red and green bars represent upregulated (i.e., genes with higher levels in obese ACs than in lean ACs) and downregulated genes (i.e., genes with lower levels in obese ACs than in lean ACs), respectively. The functional terms with top significance by sorting P values in the GO analysis are represented only in the graph. The scale on the bottom indicates the -log10 P value of the significance of enrichment of each functional term. c PCA analysis. PCA analysis is performed with ‘Class I: AC-DEGs’. The emergence of ‘I-AC’ samples identified in (a) is confirmed as the samples in the group are located in the middle of the plot marked with dotted circles. d Box plot analysis of selected clinical information among ‘Le-AC’, ‘I-AC’, and ‘Oe-AC’ samples; BMI, WC, FPG, C-pep, LDL, and HDL were selected. The statistical test of clinical information among the groups was performed by the ‘Wilcoxon rank-sum test’. ‘*’ indicates that the statistical test is P < 0.05

