
Fig. 6.
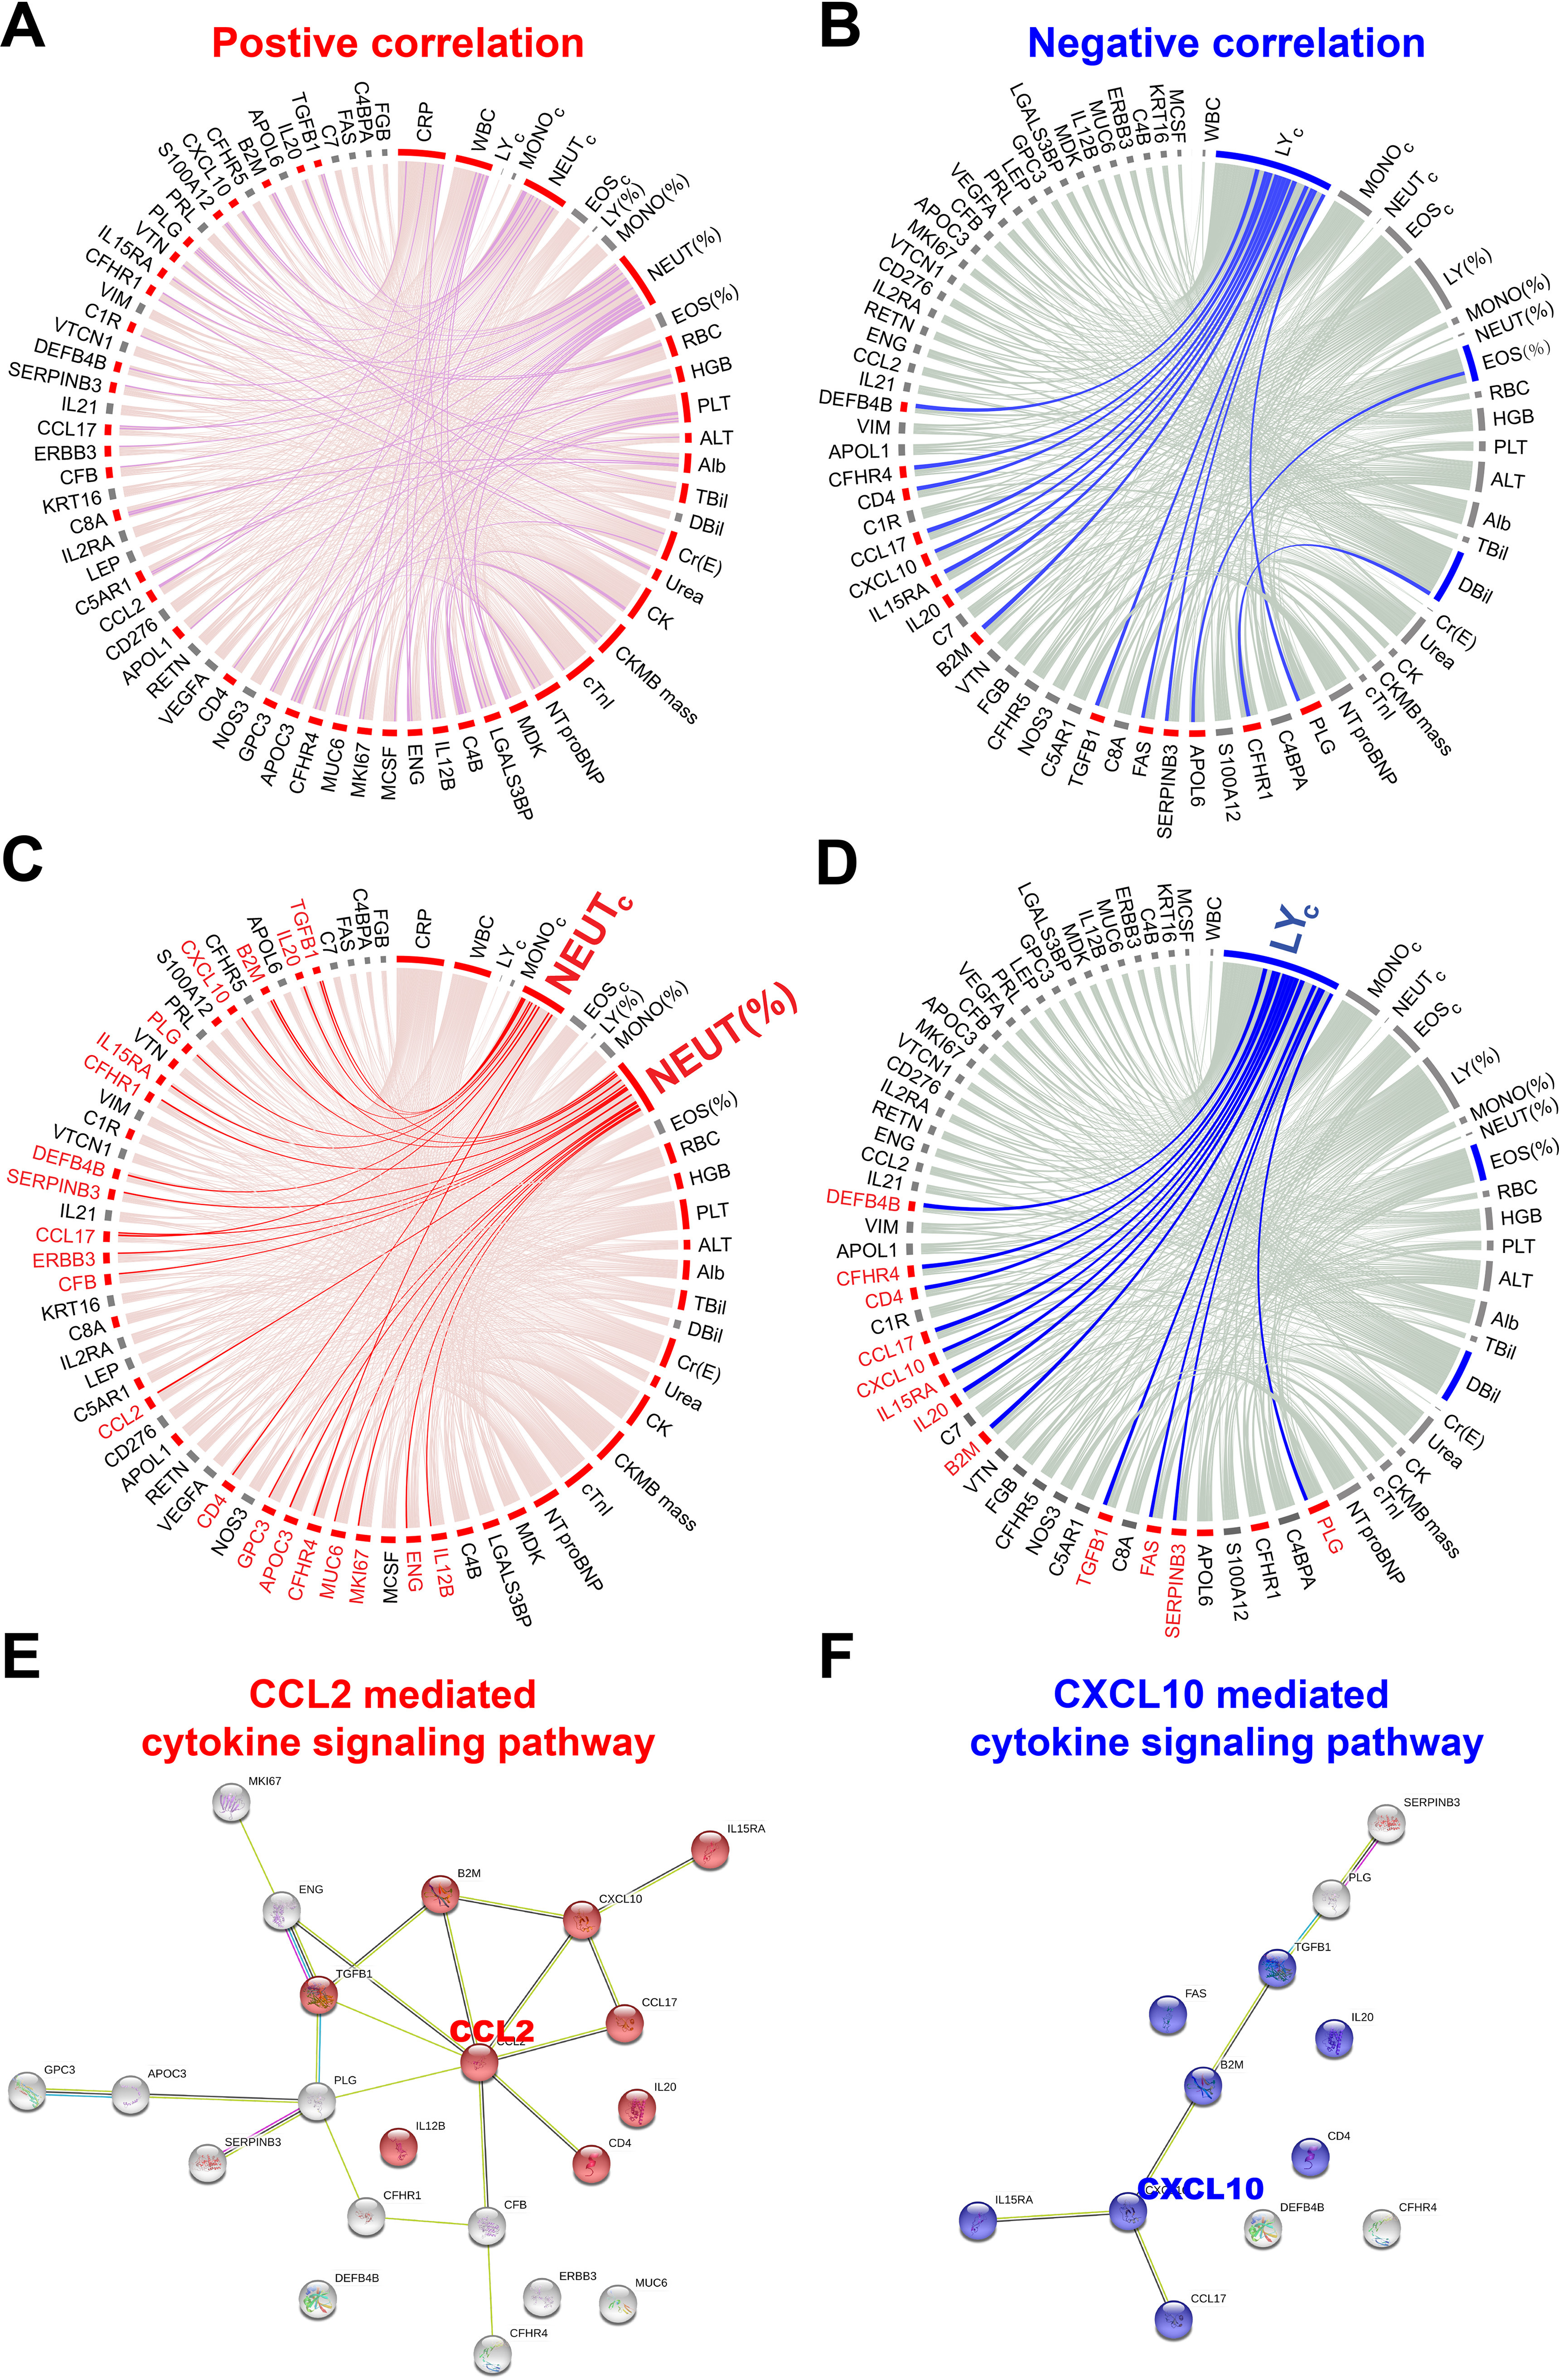
Correlation network of early COVID-19 specific proteins and clinical indices. A, and B, are the positive and negative correlations of early SARS-CoV-2 infections and twenty clinical indices using circus, respectively. Correlations with statistical significance (p-value < 0.05) are indicated in pink. Nonsignificant (p-value ≥ 0.05) positive and negative correlations are indicated in red and blue, respectively. C, and D, are proteins correlated with neutrophils and lymphocytes, respectively. E, and F, are the protein-protein interaction networks of COVID-19 proteins that are positively and negatively associated, respectively, with neutrophils and lymphocytes. The protein-protein interactions and KEGG pathway analysis were performed in the STRING database (https://string-db.org/).