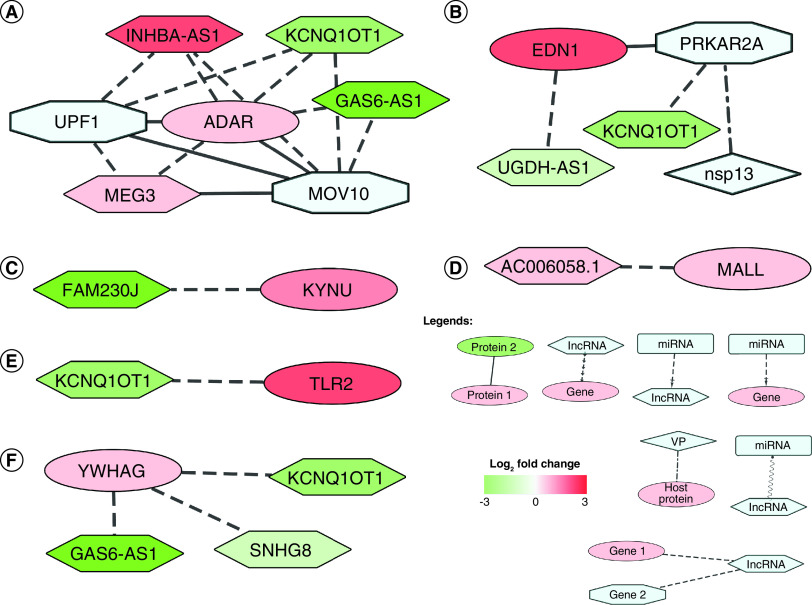
Figure 2. . Differentially expressed long noncoding RNAs interact with differentially expressed protein-coding genes.
(A) Upregulated ADAR interacts with downregulated KCNQ1OT1 and GAS6-AS1, and upregulated MEG3 and INHBA-AS1; it also interacts with UPF1 and MOV10. (B) Upregulated EDN1 interacts with downregulated UGDH-AS1 and Nsp13 interactor PRKAR2A. (C) KYNU mRNA interacts with downregulated FAM230J. (D) Upregulated MALL interacts with upregulated AC006058.1. (E) Upregulated TLR2 interacts with downregulated KCNQ1OT1. (F) YWHAG protein interacts with downregulated KCNQ1OT1, SNHG8 and GAS6-AS1. Node shape legends: ellipse: DE gene; hexagon: lncRNA; diamond: VP; octagon: viral protein interactor; rectangle: microRNA; types of edges are- dot-dash: VP-host protein interaction; dash: lncRNA–gene interaction; dash-arrow: miRNA–gene interaction; solid: PPI; sine wave: ceRNA; separate arrows: alternate target. Log2 fold change color scale is as depicted in Figure 1.
ceRNA: Competing endogenous RNA; DE: Differentially expressed; lncRNA: Long noncoding RNA; PPI: Protein–protein interaction; VP: Viral protein.

