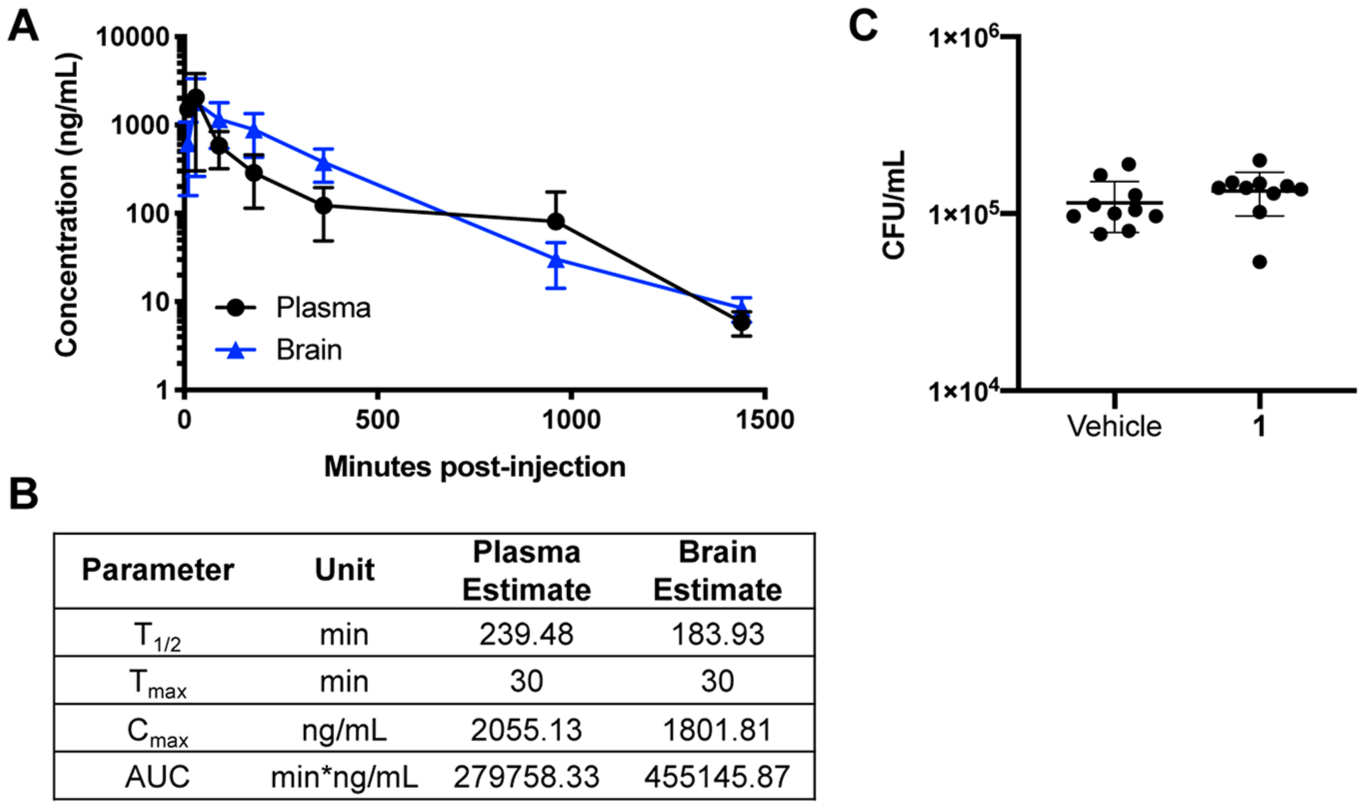
Figure 7.

Pharmacokinetics of BTU derivatives are favorable and penetrate the blood brain barrier. (A) In vivo pharmacokinetics of 1 given as a single 50 mg/kg dose. Data represent mean and SD of 3 mice per group. (B) Values for the half-life (T1/2), maximum concentration (Cmax), time of maximum concentration (Tmax), and area under the curve (AUC). (C) CFU counts from brains of mice treated every 8 h for 48 h with vehicle or 1 (50 mg/kg). n = 10 mice/group. Data are plotted as individual data points with mean and SD.
