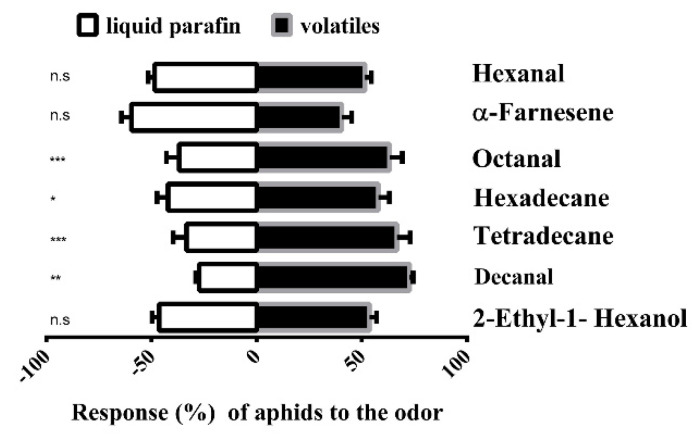
Figure 4.
Y-tube olfactometer test of the response of Sitobion avenae to compounds. The number (mean ± SE) of wingless adults of aphids in Y-tube tests between liquid paraffin (control) and different odorant chemicals. The chi-square test was used to assess the significant differences in the number of insects being attracted by an odor. The number of stars represents the p values at a significant level; i.e., *** p ≤ 0.001, ** p ≤ 0.01, and * p ≤ 0.05, while “n.s” represents the non-significant response during the choice test.

