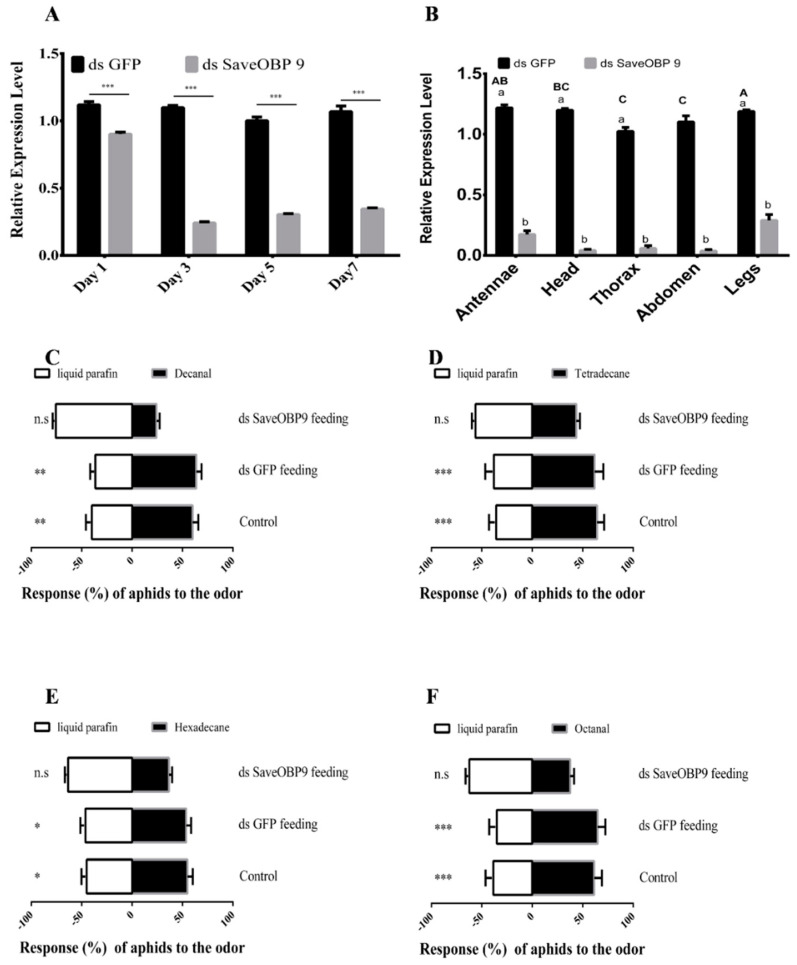
Figure 5.
Dietary RNA interference of SaveOBP9 and change in expression level after gene silencing. (A) Analysis of mRNA transcript levels of SaveOBP9 after dsSaveOBP9 feeding for 1, 3, 5, and 7 days. (B) Analysis of mRNA transcript levels in different tissues of SaveOBP9 after dsSaveOBP9 feeding after 3 days. β actin was used as an internal reference gene. The results were evaluated using a 2−ΔΔCT method, and the 2−ΔΔCT value of calibration equals 1.0. Asterisks on the upper side of the bars identify that the values were significantly different (*** p ≤ 0.001, ** p ≤ 0.01, and * p ≤ 0.05, independent samples t-test, n = 3), while “n.s” represents the non-significant response during the choice test. Small letters (a,b) identify the significant differences between the control and treatment, while capital letters (A,AB,BC, and C) represent the statistical differences among the different body parts. (C–F) Post-RNA interference (RNAi) behavior response of Sitobion avenae adults toward decanal, tetradecane, hexadecane, and octanal, respectively.

