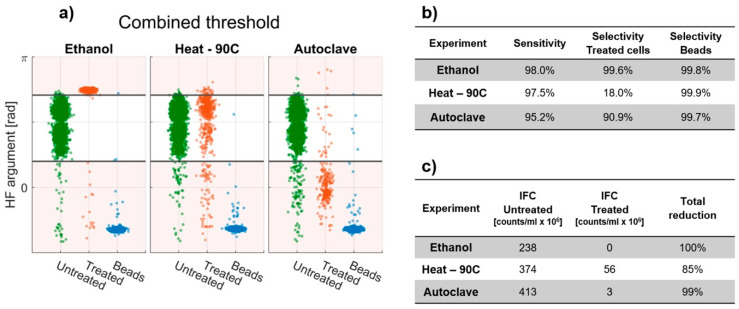
Figure 6.
(a) Categorical scatter plot showing the HF argument for the untreated samples and the treated samples from the ethanol, heat and autoclave experiments. The horizontal black lines indicate the upper and lower threshold (2.22 and 0.68, respectively) used to classify viable and non-viable cells. (b) Sensitivity and selectivity found using the dual thresholds for each of the inactivation experiments. (c) Viable bacteria counts detected with Impedance Flow Cytometry (IFC) using the combined thresholds to characterize the cells for the treated and untreated samples together with the total reduction in cell count after inactivation.

