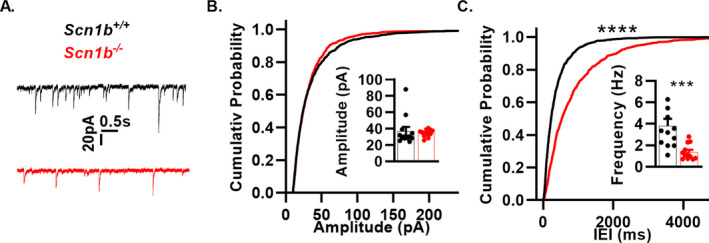
Figure 6.

Scn1b deletion impairs inhibitory neurotransmission. (A) Representative sIPSC traces from whole‐cell recordings from layer 6 pyramidal neurons of Scn1b +/+ (black) and Scn1b ‐/‐ (red) mice. (B) Cumulative probability plots of sIPSC amplitude (n/N = 12/4 Scn1b +/+, 12/4 Scn1b ‐/‐) as in A. Inset bar graphs show mean sIPSC amplitude. (C) Cumulative probability plot of interevent intervals as in A. Top asterisks indicate P‐value for comparing cumulative probabilities (****P < 0.0001, Kolmogorov–Smirnov test). Inset bar graphs shown mean sIPSC frequency (1/IEI). Asterisk indicates P‐value (***P < 0.005, Welch’s t‐test).
