
Figure 4.
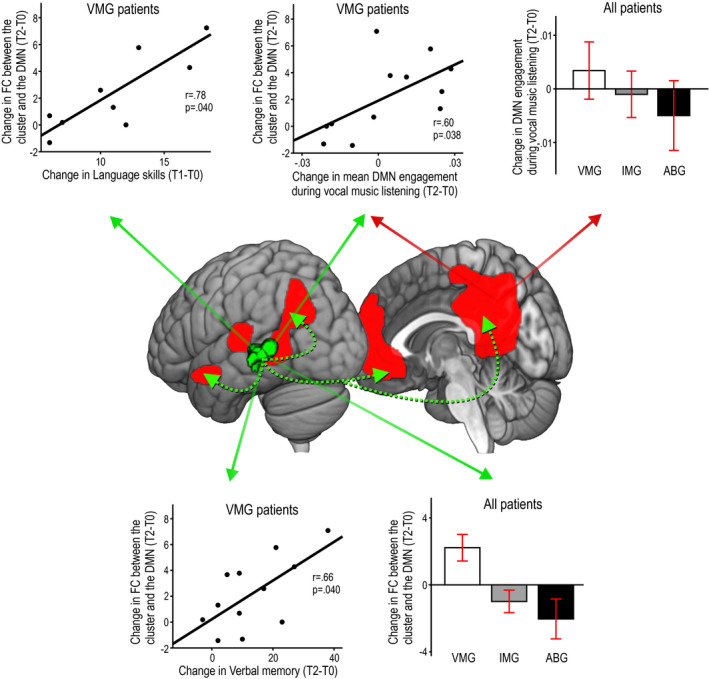
fMRI results on functional connectivity from the Turku study (N = 35). Significant group differences in functional connectivity (FC) from acute (T0) to 6‐month (T2) stage between the default mode network (DMN) and the left temporal (STG/MTG) areas in the resting‐state condition (cluster shown in green–black color scale) and the mean engagement of the DMN during the Vocal music listening condition (DMN illustrated in red color). Spatial results in the resting‐state condition are at P < 0.005 (uncorrected) and only the cluster surviving a FWE‐corrected P < 0.05 threshold is shown. Group differences are shown in histograms (mean ± SEM), and correlations within the VMG (N = 12) are shown in scatterplots. The histograms/scatterplots showing results in the resting‐state condition are marked with green solid arrows and those showing results in the vocal music listening condition are marked with red solid arrows. Dashed green arrows illustrate FC between the left temporal cluster and the other parts of the DMN. ABG = Audiobook group, IMG = Instrumental music group, T0 = baseline (acute), T1 = 3‐month stage, T2 = 6‐month stage, VMG = Vocal music group.