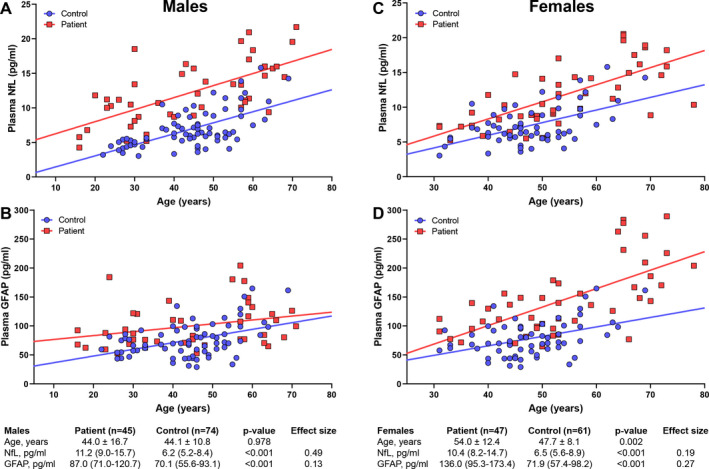
Figure 1.

Plasma NfL and GFAP levels in patients versus healthy controls. Graphs show NfL and GFAP levels plotted against age in male (left panel, A and B) and female (right panel, C and D) patients. Values in the tables below the graphs are the median NfL and GFAP levels per group (IQR); p‐values represent the significance level of the difference between groups after correction for age (ANCOVA). Age is displayed as mean ± SD, difference in age was assessed with unpaired t‐test. Effect sizes are the partial eta squared values from the ANCOVA models. GFAP, Glial Fibrillary Acidic Protein; NfL, Neurofilament light.
