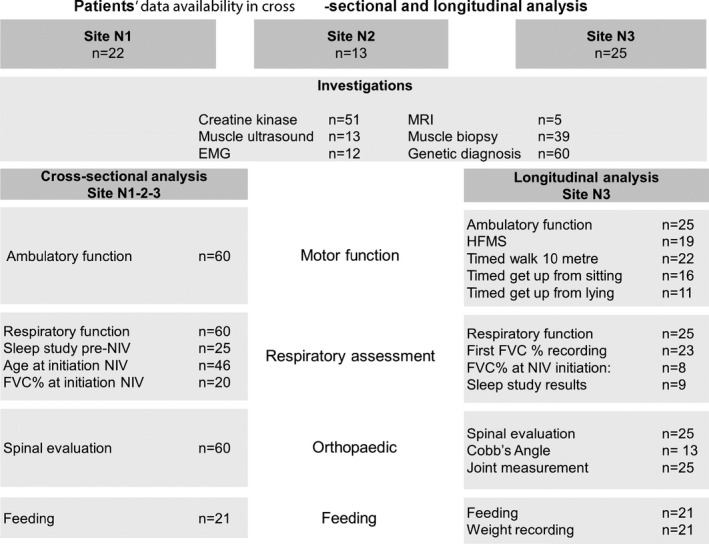
Figure 1.

Patients’ data availability in cross‐sectional and longitudinal analysis. Flow diagram showing the number of patients for whom cross‐sectional and longitudinal data is available for different investigations and assessment. Sites are indicated on the top. n: number; EMG electromyography; MRI muscle magnetic resonance imaging; NIV noninvasive ventilation; FVC Forced vital capacity; FVC% forced vital capacity percentage predicted; HFMS Hammersmith Functional motor score.
