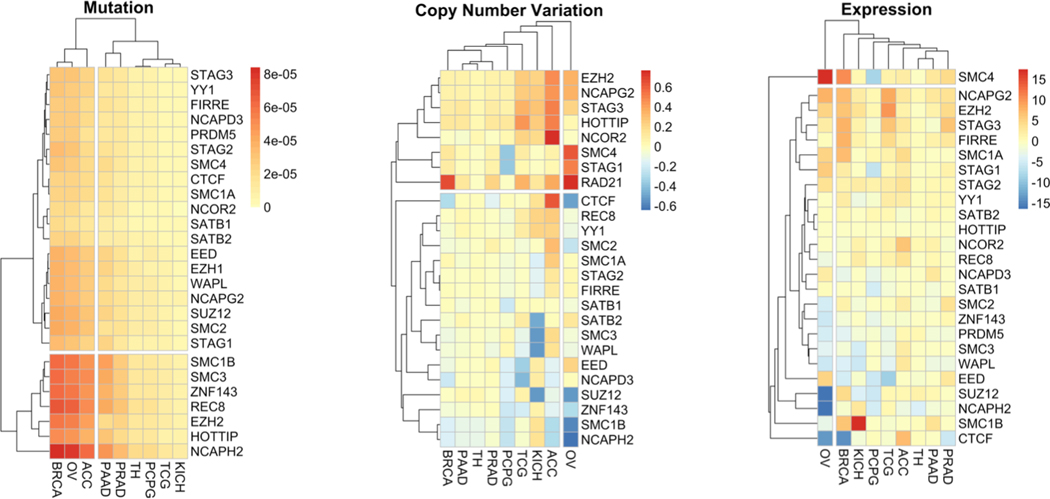
Figure 2: Mutation, copy number variation and expression of genes involved in boundary formation in hormone responsive cancers.
Gene mutation, copy number variation and expression z-score pan-cancer data for breast (BRCA), ovarian (OV), pancreatic (PAAD), prostate (PRAD), thyroid (TH), pheochromocytoma (PCPG), Testicular Germ Cell (TCG), Adrenocortical (ACC) were downloaded using the R platform for statistical computing using the cgdsr package. The genes selected were chosen by the studies highlighted in the text, as well as choosing paralogs identified by Human Genome Nomenclature. Gene mutation and copy number variation data was normalized to the number of tumors within the cohort, and also normalized to gene length for the mutation data. The normalized mutation, copy number variation and expression was then visualized as a heatmap (pheatmap) using average Manhattan clustering.

