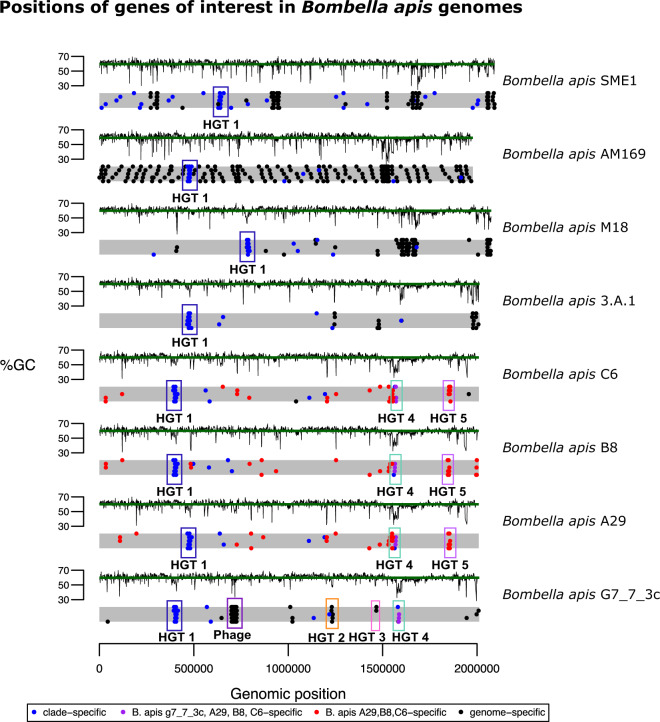
Fig. 3.
Genomic locations of genes of interest in Bombella and Saccharibacter genomes. Each gray bar is a representation of the genome, with each dot representing the location of a gene in each of four categories (see legend). Regions of interest mentioned in the text are highlighted and labeled. %GC for every gene is plotted above each genome representation, with the green line indicating the genome-wide average %GC.

