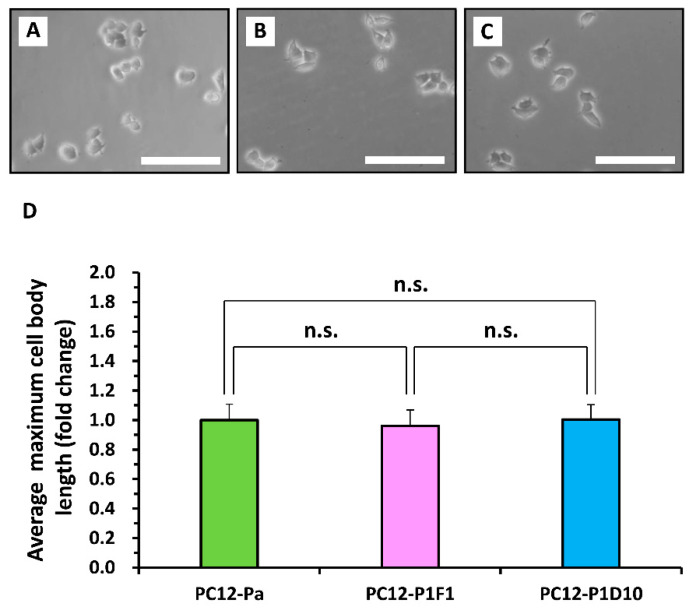
Figure 2.
Comparison of cell morphology among the PC12, PC12-P1F1, and PC12-P1D10 cell lines. One day before microscopic observation, the parental PC12 cell line and its two subclones (PC12-P1F1 and PC12-P1D10) were seeded into culture medium on 24-well culture plates. (A–C) Representative phase-contrast micrographs of cultured cells from each cell line. Scale bars, 50 μm. Similar results were obtained in three independent experiments. (D) Average values of the maximum cell body length (n = 27) in each cell line calculated using data acquired from the phase-contrast micrographs. Results are presented as fold change relative to PC12-Pa. The data represent the means ± standard deviation of three replicates. PC12-Pa, parental PC12 cells; n.s., not significant.

