Figure 7.
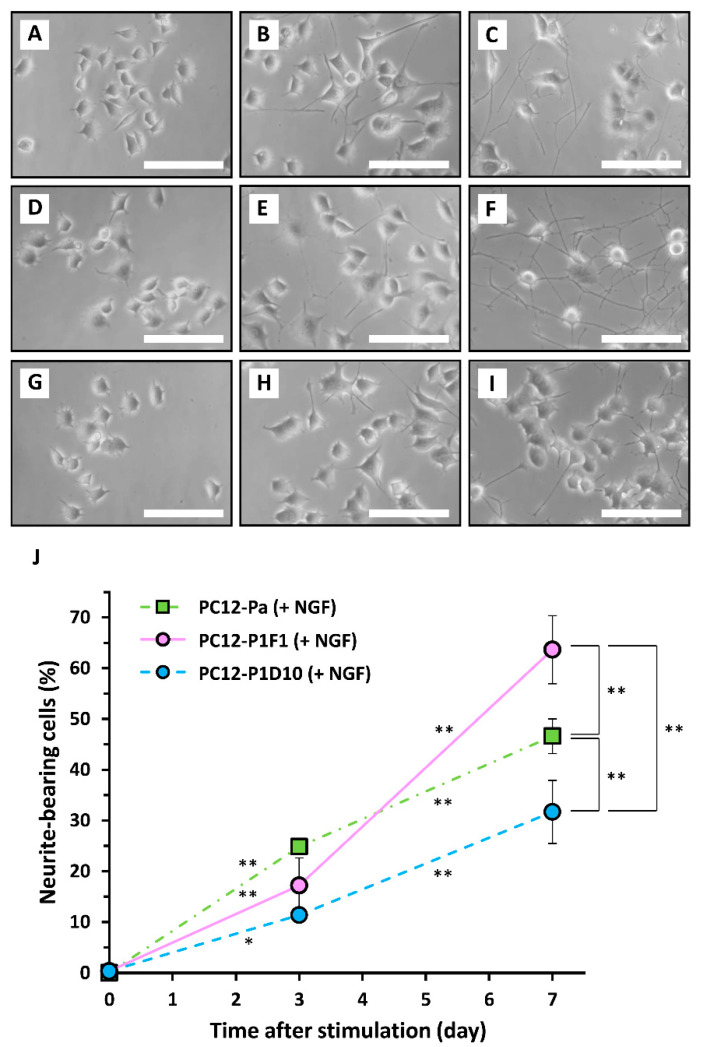
Time-course of nerve growth factor (NGF)-induced neuritogenesis in parental PC12, PC12-P1F1, and PC12-P1D10 cells. Parental PC12, PC12-P1F1, and PC12-P1D10 cells were exposed to 50 ng/mL NGF for 7 days, and the extent of neuritogenesis was evaluated. Phase-contrast images of parental PC12 cells on day 0 prior to NGF exposure (A), and on days 3 (B) and 7 (C) after exposure to NGF. Phase-contrast images of PC12-P1F1 cells on day 0 prior to exposure to NGF (D), and on days 3 (E) and 7 (F) after exposure to NGF. Phase-contrast images of PC12-P1D10 cells on day 0 prior to exposure to NGF (G), and on days 3 (H) and 7 (I) after NGF exposure. Scale bars, 50 μm. Similar results were obtained in three independent experiments. (J) Parental PC12, PC12-P1F1, and PC12-P1D10 cells were exposed to 50 ng/mL NGF for 7 days and the percentages of neurite-bearing cells on days 0, 3, and 7 were determined. The data represent the means ± standard deviation of three replicates. PC12-Pa, parental PC12. *, ** p < 0.05, 0.01, respectively.

