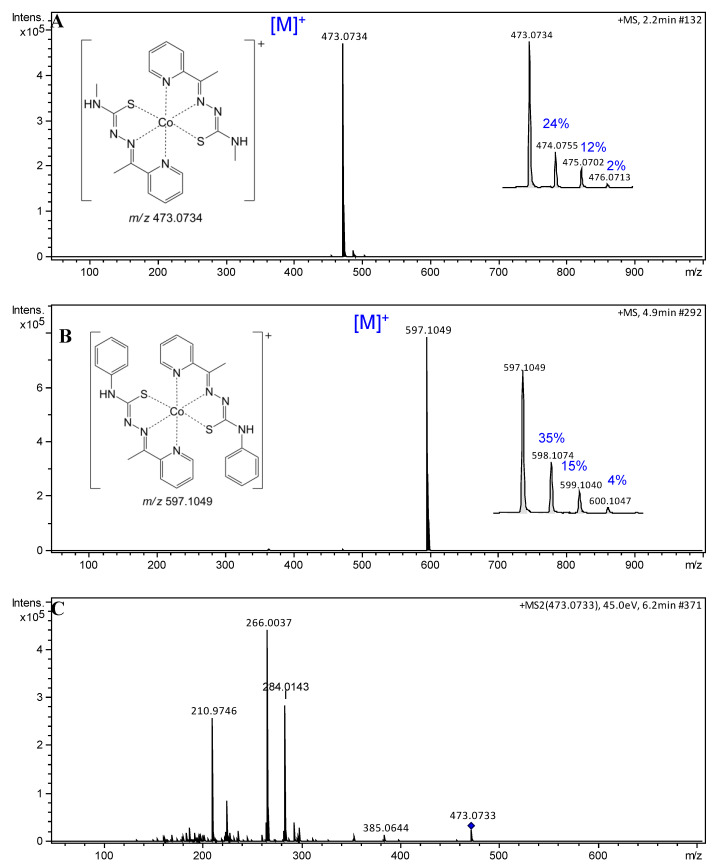
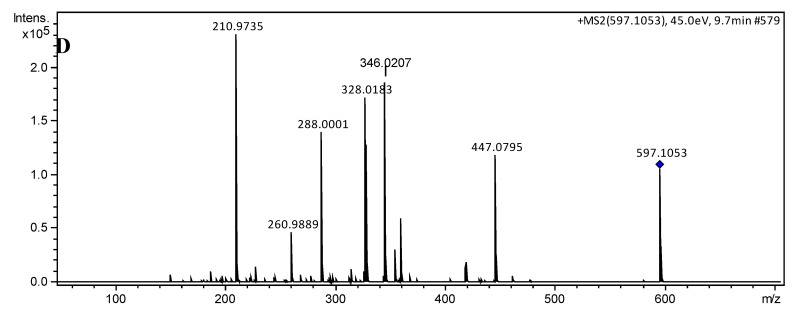
Figure 1.
Electrospray ionization (ESI) mass spectra of cobalt(III) complexes 1 and 2. (A) (+)-high-resolution electrospray ionization mass spectra (HRESIMS) spectrum of 1, m/z 473.0734 [M]+ (calcd. for C18H22CoN8S2, 473.0735, Δ –0.21 ppm); (B) (+)-HRESIMS spectrum of 2, m/z 597.1049 [M]+ (calcd. for C28H26CoN8S2, 597.1048, Δ 0.17 ppm); (C) ESI–MS/MS spectrum of the molecular ion m/z 473.0733; and (D) ESI–MS/MS spectrum of the molecular ion m/z 597.1053.


