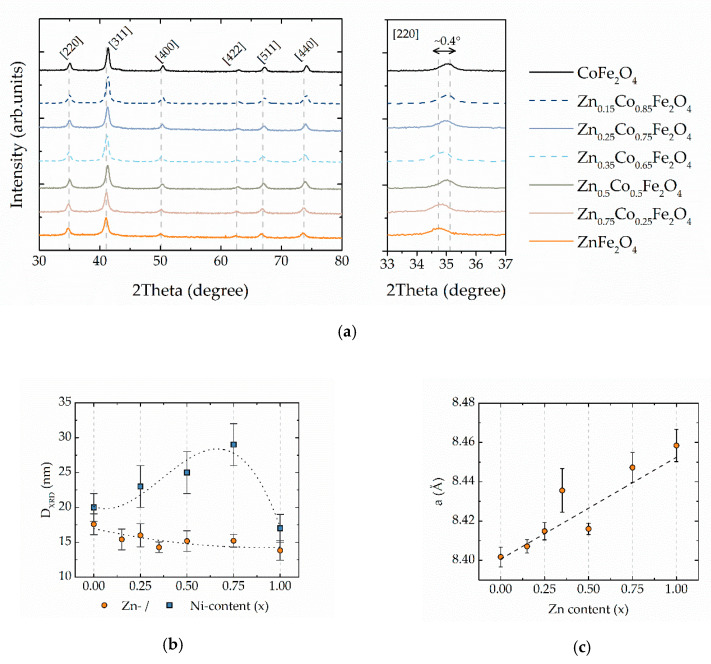
Figure 1.
(a) diffraction patterns for all samples, in the left panel is a zoomed region for [220] reflection showing the shift of peak position; the Miller indexes for corresponding peaks are reported; (b) evolution of grain size (DXRD) calculated with Scherrer formula through zinc content compared with the values obtained for Ni-Co ferrite MNPs in ref. [37]. Error bars are the standard deviation of DXRD calculated for 5 most intensive peaks; (c) lattice parameter (a) as a function of zinc content.

