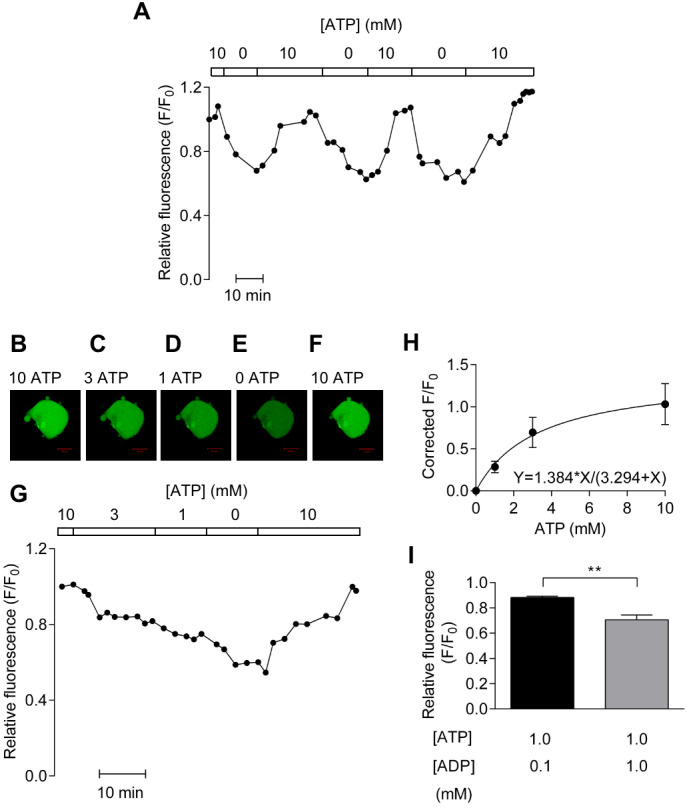
Figure 1. In vitro calibration of PercevalHR.

(A) PercevalHR fluorescence from a single HCASMC permeabilized with α-toxin repeatedly exposed to 10 and 0 mM ATP. (B–G) PercevalHR fluorescence determined over physiological range of ATP concentrations (G) with confocal images of HCASMC (B–F). Scale bar is 50 µm. (H) Concentration-response relationship between ATP concentration and corrected fractional fluorescence (F/F0) with KD of ∼3.3 mM ATP (n = 4 from four independent experiments). (I) Mean ± SEM of PercevalHR fluorescence determined with 0.1 mM ADP/1 mM ATP is significantly different from that with 1 mM ADP/1 mM ATP (p < 0.01, paired Student’s t-test, n = 5 from five independent experiments).
