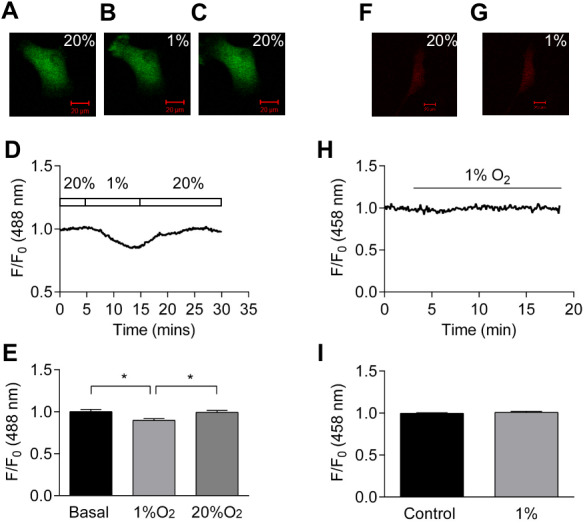
Figure 4. Effect of hypoxia on intracellular ATP:ADP ratio.

(A–C) Confocal images of HCASMC expressing Perceval under control condition (A), after 10 minutes exposure to hypoxia (B), and recovery after re-oxygenation (C). (D) Time course of Perceval fractional fluorescence. (E) Exposure to hypoxia (1% O2) significantly changed Perceval fluorescence compared to control (basal) and recovery (20% O2) (p < 0.05, ANOVA with Tukey’s test for post hoc analysis, n = 5 from five independent experiments). (F–G) Confocal images of HCASMC expressing pHRed under control condition and during exposure to 1% O2. (H): Time course of fractional fluorescence. (I) Hypoxia caused little change in intracellular pH (bottom panel, n = 5 from five independent experiments).
