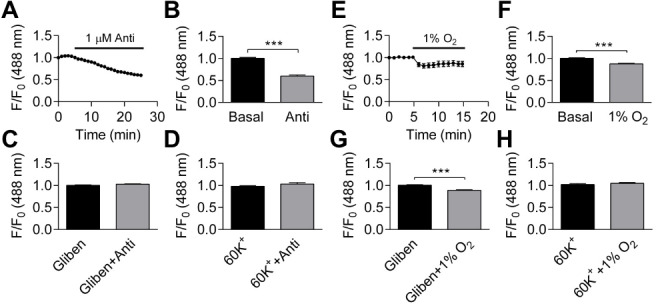
Figure 6. Effects of antimycin and hypoxia on membrane potential.

(A–B) Application of 1 µM antimycin caused significant reduction in fractional fluorescence (p < 0.001, paired Student’s t-test, n = 25 from one experiment). (C–D) Pretreating the cells either with 10 µM glibenclamide (C, n = 22 from one experiment) or 60 K+ (D, n = 6 from one experiment) abolished the change induced by antimycin. (E–F) Hypoxia caused significant decrease in fractional fluorescence (p < 0.001, paired Student’s t-test, n = 72 from 11 independent experiments). (G–H): The effect of hypoxia was not blocked by 10 µM glibenclamide (G p < 0.001, paired Student’s t-test, n = 36 from four independent experiments), but hypoxia was ineffective with extracellular 60 K+ (H, n = 11 from two independent experiments, NS).
