
Figure 1.
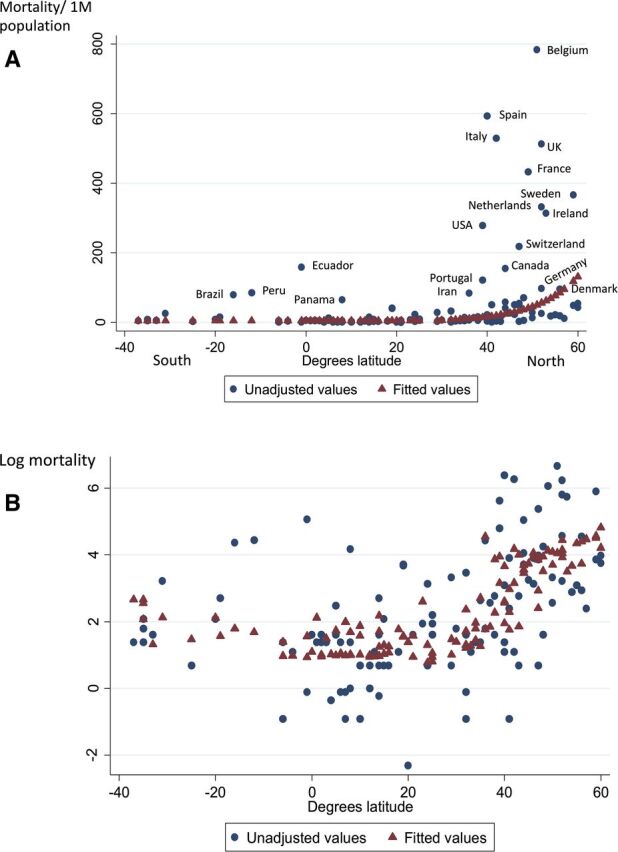
A. COVID-19 mortality per 1 million population by country compared with latitude of capital cities. Fitted values are derived from a piecewise linear model of the logarithm of mortality on latitude. This was based on a threshold of 28° north that explained the greatest amount of variation. B. Logarithm of COVID-19 mortality per 1 million compared with latitude with and without adjustment for age (%≥65 years).