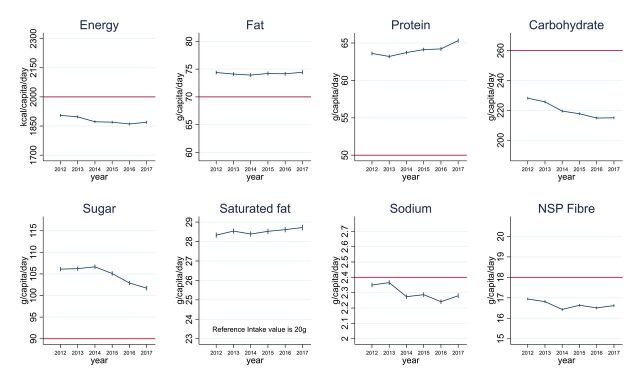
Figure 1.
Daily energy and nutrient purchases per capita in Great Britain. Data are from 213 663 901 transactions reported by 50 672 households participating in UK Kantar FMCG panel between 2012 and 2017. Values are mean daily per capita energy and nutrient purchased to take-home. The red horizontal line indicates the reference intake values and the national recommendation of 18 g for NSP fibre, which is equivalent to 30 g of fibre. The ranges of the y-axes are 30% of the reference intake values so that changes in the y-axes and differences with the reference intake values are visually comparable across nutrients. When the differences with the reference intake values were within 15%, the y-axes were centred on the reference intake value. The difference between saturated fat purchases and the reference intake value was greater than 30% so that it could not be displayed on the graph. Some puddings, biscuits and bread products, as well as all bacon and sausages, slimming products and milkshake mixes were excluded because of inconsistent nutrient information reported at product level. Products excluded could account for up 130 kcal/capita/day each year. NSP, non-starch polysaccharides.

