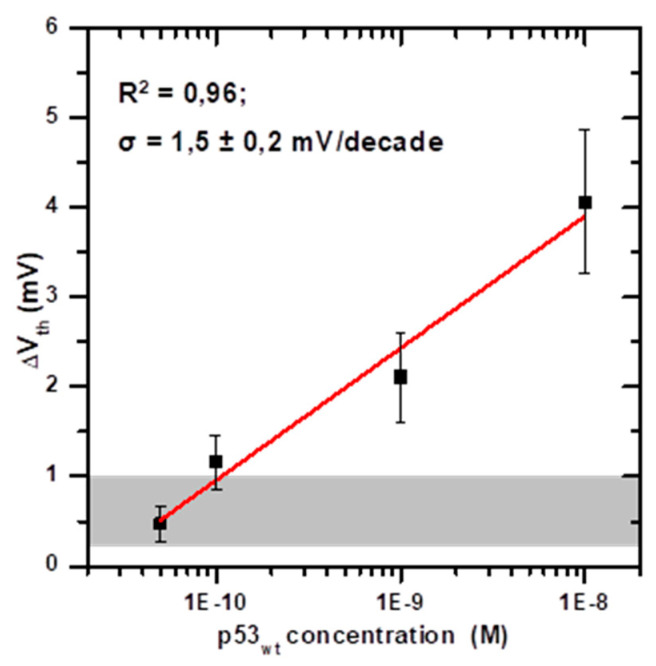
Figure 6.
Calibration curve of the BioFET for the detection of p53wt, as obtained by plotting the average values of the threshold voltage (Vth) variation as a function of the p53wt concentration in PBS 100 mM pH 8.0, on a semilogarithmic scale. The error bars represent the standard deviation. The regression line (R2 = 0.96) is reported in red. From the slope of the regression line, the sensitivity σ = 1.5 ± 0.2 mV/decade is obtained. The grey area in the bottom represents the range of Vth variations obtained by injecting the working buffer with diluted other proteins (0.6 ± 0.4 mV), which can be considered as the blank signal.

