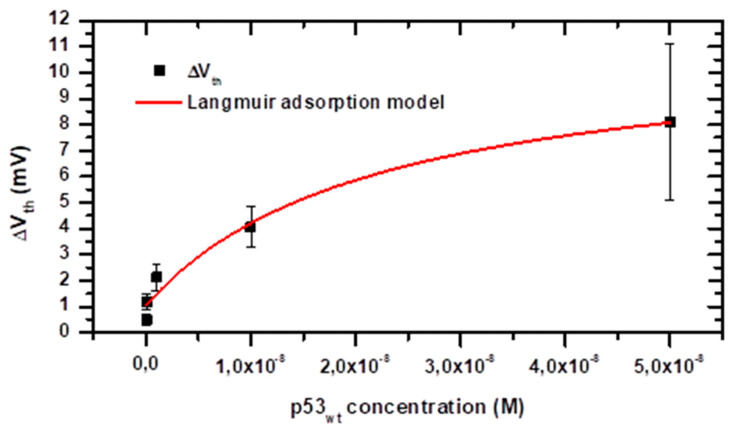
Figure 7.
Mean threshold voltage (Vth) changes as a function of the p53wt concentration in PBS 100 mM pH 8.0 solution. The error bars represent the data standard deviation. The data have been fitted by an adapted version of the Langmuir adsorption model including an offset to take into account the blank signal (see text). The parameters extracted by fitting the experimental data according to the Langmuir adsorption model (continuous red line; R2 = 0.96) are: offset ΔV0 = 1.0 ± 0.4 mV, ΔVthmax = (10.1 ± 2.2) mV, KD = (2.2 ± 1.3) × 10−8 M.

