Figure 3.
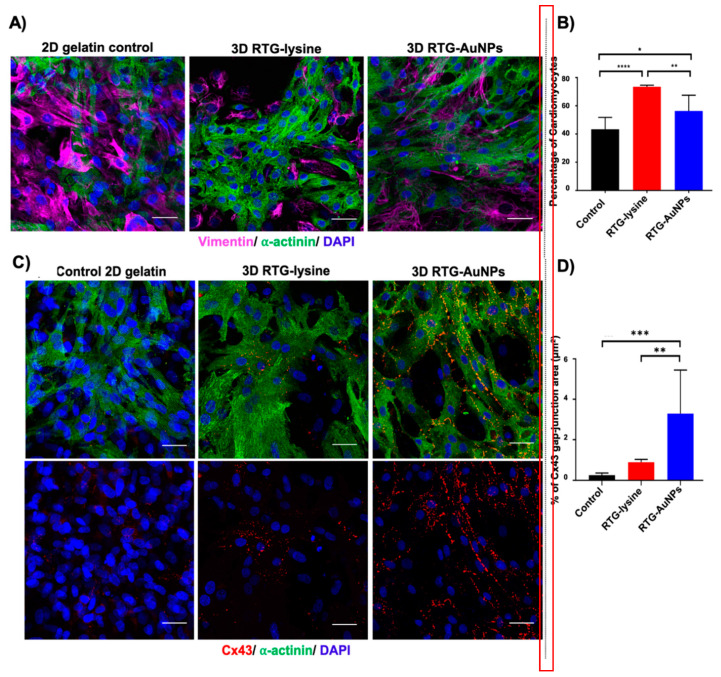
Upper panel: Immunocytochemistry labeling of NRVMs and cardiac fibroblasts (CFs) cultured in 2D and 3D systems for 21 days. (A) Antibody staining against α-actinin (green) and vimentin (pink) label NRVMs and CFs, respectively, with nuclei labeled using DAPI (blue). (B) Quantification of immunocytochemistry staining against α-actinin indicates percentage of cells likely to be NRVMs, showing both 3D systems to contain a greater percentage of NRVMs than the 2D gelatin control. Scale bar 40 µm. p values: * < 0.023, ** < 0.0017 and **** < 0.0001. Data are presented as mean ± S.D. Lower panel: Immunocytochemistry labeling of gap junctions in NRVMs cultured in 2D and 3D systems for 21 days. (C) Antibody staining against connexin 43 (Cx43) (red) and α-actinin (green), with nuclei labeled using DAPI (blue). (D) Quantification of immunocytochemistry staining against Cx43 to indicate surface area of NRVMs positive for this gap junction protein, showing the RTG-AuNPs system to contain the largest Cx43-positive area. Scale bar: 40 μm. p values: ** < 0.0021 and *** < 0.0002. Data are presented as mean ± S.D. Reprinted with permission from [81] Copyright 2019 American Chemical Society.

