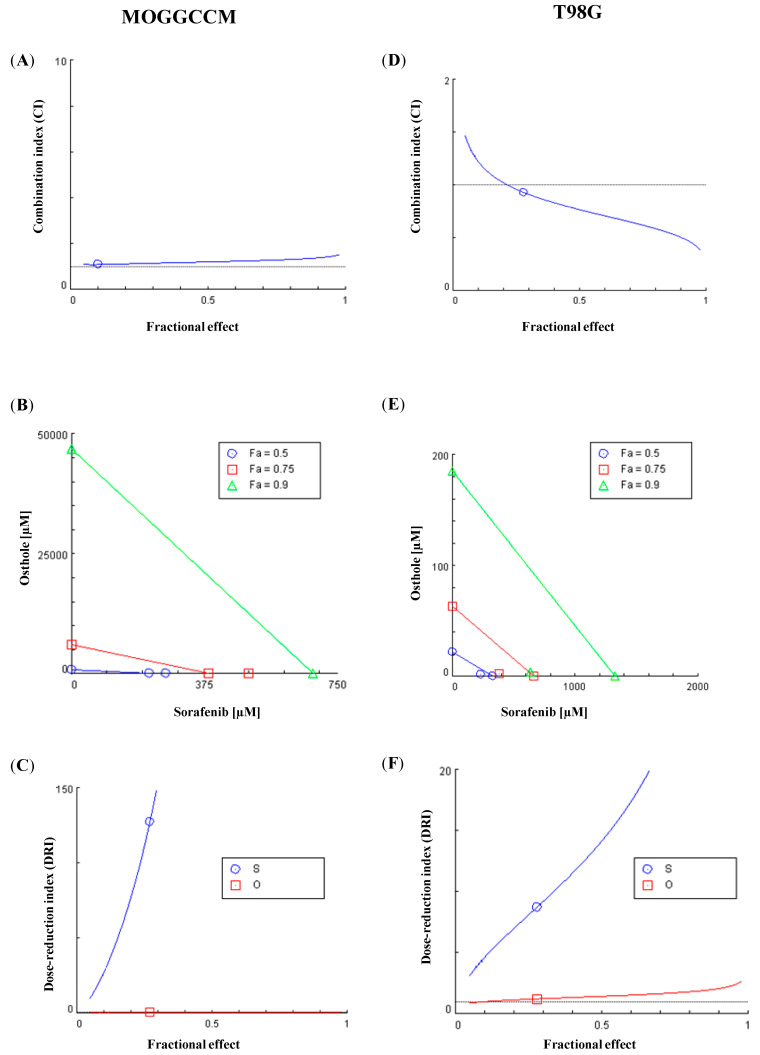
Figure 6.
Osthole (O) and sorafenib (S) combination treatment in the MOGGCCM (A–C) and T98G (D–F) cell line. (A,D) Combination index (CI) plot: the combination index is plotted as a function of Fa (fractional effect, line of blue color). (B,E) Isobologram for the combination: classic isobologram at IC50, IC75, and IC90. (C,F) Fa-DRI (dose-reduction index) plot (Chou-Martin plot).

