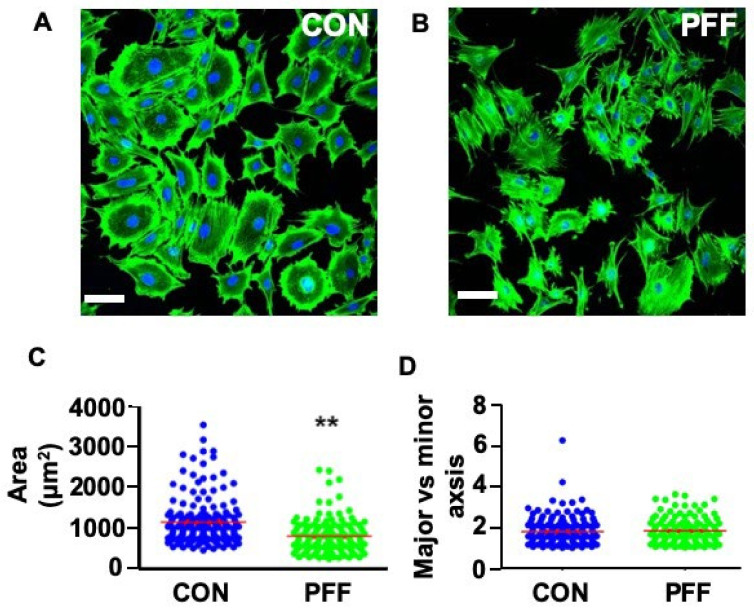
Figure 2.
Effect of 1 h PFF on the spreading of MC3T3-E1 osteoblasts. (A) 2D image of fixed static control cells stained with phalloidin for F-actin (green) and DAPI for the nuclei (blue). (B) 2D image of 1 h PFF-treated cells stained with phalloidin and DAPI. (C) Cell spreading area measurement and analysis. (D) Cell shape/elongation measurement and analysis (cell spreading length vs. cell spreading width). N = 175 (control) and 165 (PFF) cells from 4 separate glass slides. CON, control; PFF, pulsating fluid flow. ** p < 0.01. ns, not significant. Bar = 100 µm.

