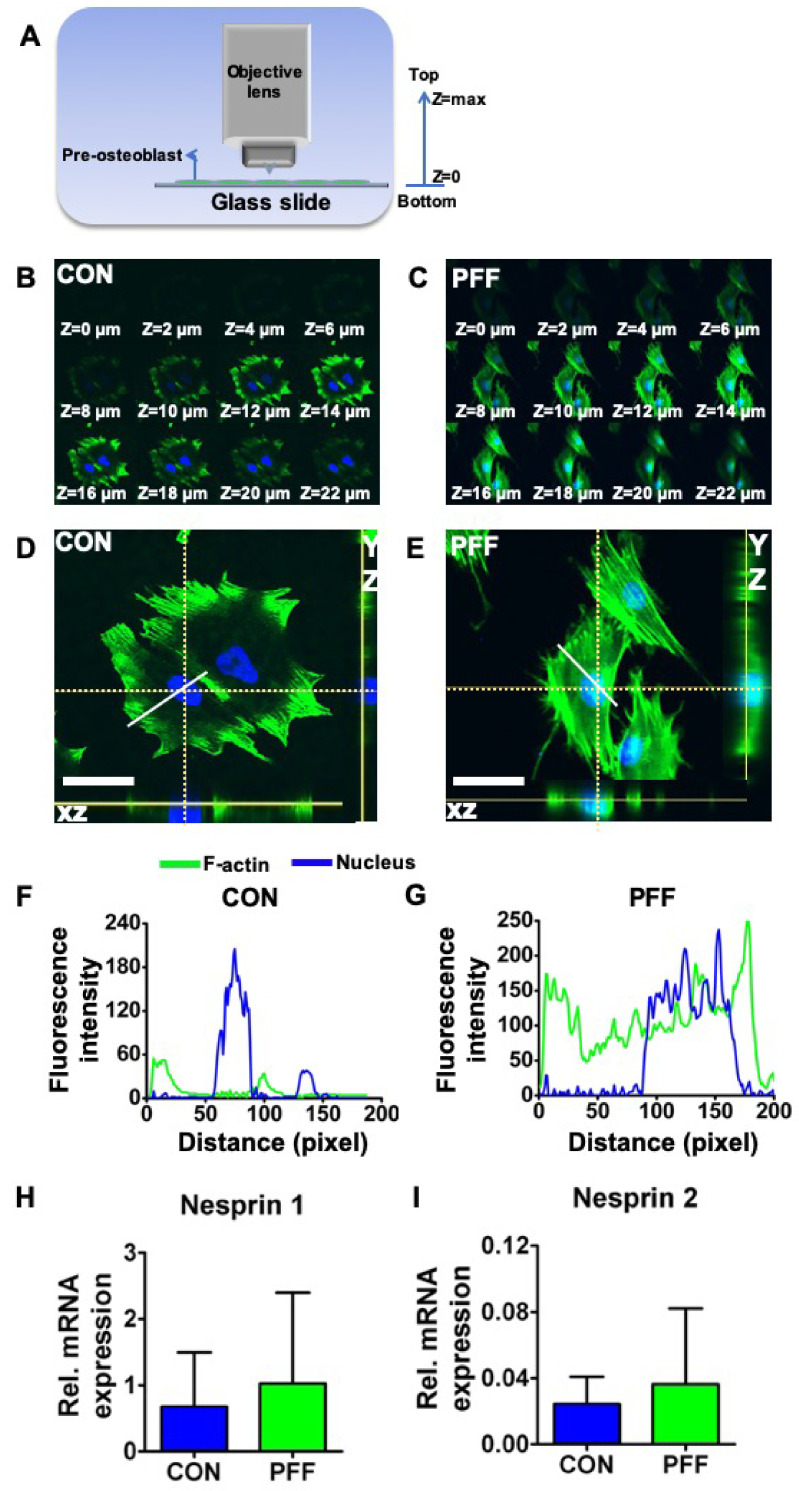
Figure 3.
Effect of 1 h PFF on 3D F-actin distribution and nucleus position based on morphology and Z-stack analysis by laser scanning confocal microscopy (LSCM), as well as nesprin 1 and 2 gene expression in MC3T3-E1 osteoblasts. (A) Illustration of confocal Z-stack scanning direction. (B) Z-stack scanning of a typical representative static control cell stained for F-actin and analyzed in the Z-direction at 2 µm intervals. (C) Z-stack scanning of a typical representative 1 h PFF-treated cell. (D) Top, XZ, and YZ view of a static control cell. The position of the XZ and XY view are along the dotted white lines. (E) Top, XZ, and YZ view of a representative cell, subjected for 1h with PFF. XZ and XY views are along the dotted white lines. (F) Fluorescence intensity profiles were analyzed over the solid white line drawn in Figure 3D. (G) Fluorescence intensity profiles over representative PFF-treated cells, detected along the solid white line visible in Figure 3E. Bar = 50 µm. (H) Nesprin 1 gene expression in control and PFF-treated cells. (I) Nesprin 2 gene expression in control and PFF-treated cells. CON, control; PFF, pulsating fluid flow.

