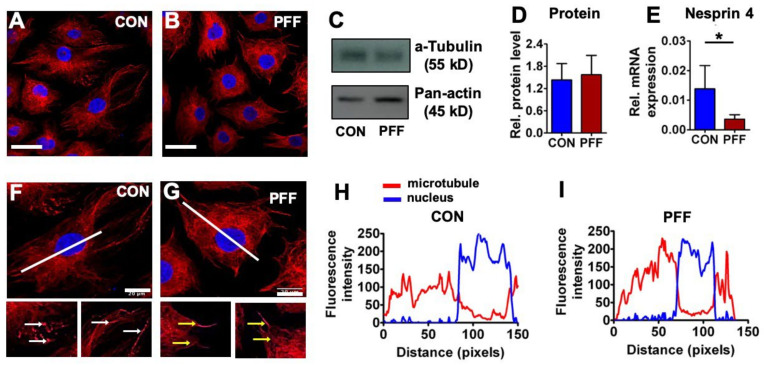
Figure 6.
Effect of 1 h PFF on α-tubulin protein expression and distribution and nesprin 4 gene expression in MC3T3-E1 osteoblasts. (A, B) 2D images of control cells and 1 h PFF-treated cells stained for α-tubulin (red) and DAPI for the nucleus (blue). Bar = 50 µm. (C, D, E) Relative α-tubulin protein expression and nesprin 4 gene expression in control and PFF-treated cells. Pan-actin was used as a control for equal loading. (F, G, H, I) Distribution and fluorescence intensity of microtubules in MC3T3-E1 osteoblasts without or with PFF treatment. The images show the distribution of microtubules in a control and PFF-treated cell. White arrows: microtubule ends; yellow arrows: microtubule. Bar = 20 um. The graphs show the fluorescence intensity of microtubules, which correspond to the white line (from upper left to lower right) in the images. Red line: microtubule; blue line: nucleus. CON, control; PFF, pulsating fluid flow. * p < 0.05.

