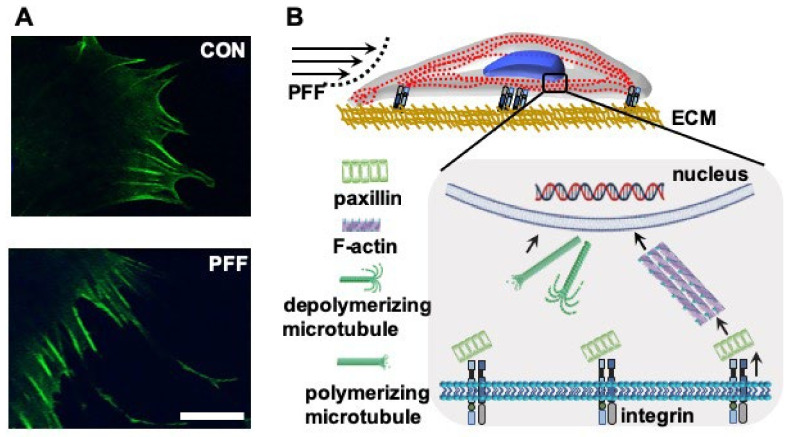
Figure 7.
Effect of 1 h PFF on F-actin distribution at the cell boundary, and schematic summary of the changes induced by PFF in MC3T3-E1 osteoblasts. (A) F-actin was visualized using phalloidin. Upper image: control cell. Lower image: PFF-treated cell. Bar = 25 µm. (B) PFF was sensed through integrins, which formed clusters of α and β-integrins. Paxillin changed from granular to short rods. F-actin was neatly arranged, and F-actin fluorescence intensity was increased by PFF. The morphology and volume of the cell body and nucleus changed in response to PFF, which might result in changed cell function. CON, control; PFF, pulsating fluid flow.

