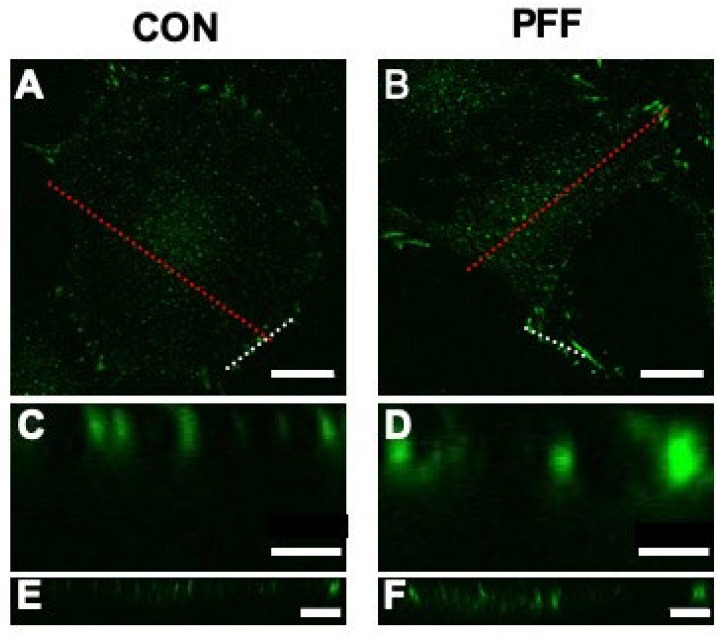
Figure A1.
Focal adhesions visualized by staining of paxillin in MC3T3-E1 cells cultured without or with 1 h PFF. Line tool (Image J) was used to draw the target area. The “Reslice” function was used, and the following parameters applied: Output spacing (microns): 0.125, Slice count: 1, Avoid interpolation (use 1 pixel spacing). (A) Paxillin morphology in control cells without PFF. Bar: 20 μm. (B) Paxillin morphology in PFF-treated cell. Bar: 20 μm. (C) Side view of the paxillin staining based on the white dotted line in (A). Bar = 10 μm. (D) Side view of paxillin based on the white dotted line in (B). Bar: 10 μm. (E) Side view of the paxillin staining based on the red dotted line in (A). Bar: 5 μm. (F) Side view of the paxillin staining based on the red dotted line in (B). Bar: 5 μm. CON, control; PFF, pulsating fluid flow.

