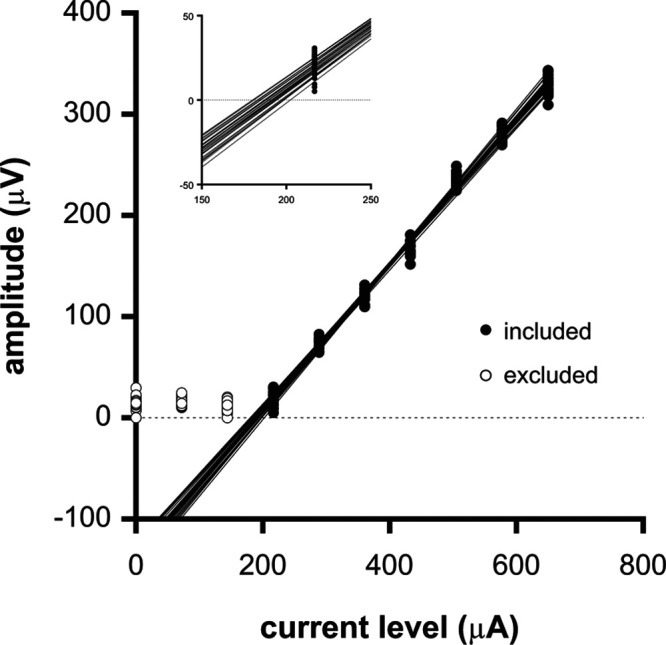
Fig. 5.

Sample data of a Monte Carlo simulation to determine the eCAP threshold variability when 1 bin (i.e., the average of 8 eCAP waveforms) was used per stimulus level to generate the AGF. AGFs were generated by randomly sampling a single bin (of the available 32) per current level. The first recording at 0 μA represents the noise floor. This recording as well as the subsequent two lowest current levels were excluded through visual inspection by an experienced audiologist and not taken into account in the regression analyses. Inset: fragment of the data shown in (A) on a larger scale showing the extrapolated eCAP thresholds to zero eCAP amplitude. For clarity, only a sample subset of 32 AGFs are shown. In reality, 1000 AGFs were generated to obtain 1000 threshold estimates. AGF, amplitude growth function; eCAP, evoked compound action potential.
