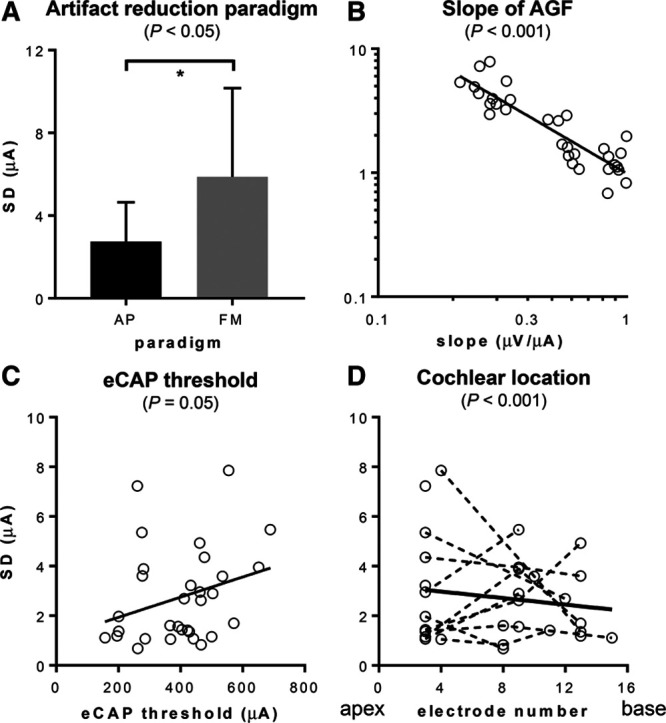
Fig. 7.

SD of the eCAP threshold in subsets of data (i.e., 32 averages and AP averaging). A, SD was significantly smaller with averaging of alternate polarities (AP) than forward masking (FM). B, SD was significantly negatively correlated with slope of the AGF. C, SDs showed a tendency to increase at higher thresholds (p = 0.05). D, SDs significantly decreased toward the base in this study. However, there was substantial intersubject variability. AGF, amplitude growth function; eCAP, evoked compound action potential.
