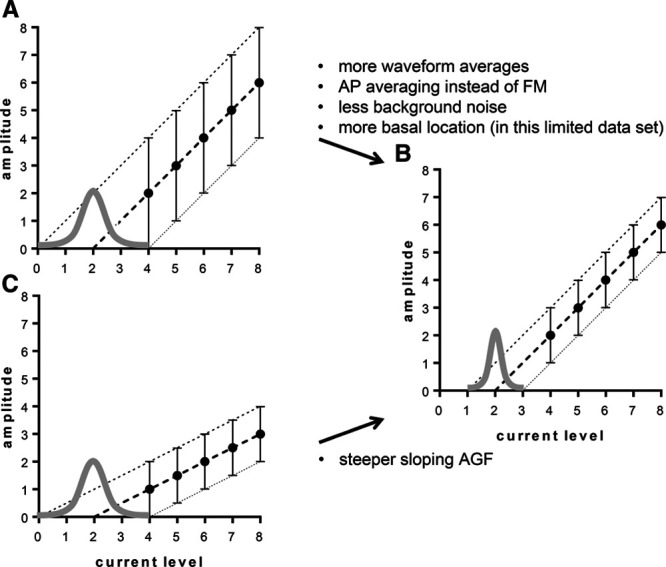
Fig. 8.

Graphical representations of the effects of the number of waveform averages (A, B), slope of the AGF (B, C), and number of current levels in the AGF (D, E) on the width (i.e., precision) of the (normal) distribution of the eCAP threshold. Error bars represent the range of eCAP amplitudes in the collection of 1000 random samples. Cochlear location also significantly affected S, which can be explained by different slopes of the AGF along the cochlea (B, C). AGF, amplitude growth function; eCAP, evoked compound action potential.
